 Despite all the talk of the Dow making new highs over the last few years the truth is actually quite different. The way an index is “weighted” can make all the difference in how it looks. In addition indexes that change their composition regularly like the DOW (i.e.removing some companies and adding better performing ones) create an unnatural upward bias.
According to AllFinancialMatters: “The Dow Jones averages are unique in that they are price weighted rather than market capitalization weighted. Their component weightings are therefore affected only by changes in the stocks’ prices, in contrast with other indexes’ weightings that are affected by both price changes and changes in the number of shares outstanding.”
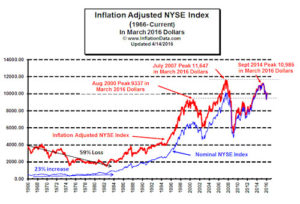
At InflationData we frequently talk about Inflation Adjusted Stock Averages using the NYSE how it showed that we really hadn’t made new highs after all. The NYSE Indexes are capitalization-weighted, adjusted for free-float shares and calculated on a price and total return basis.
In the following article Chris Ciovacco will take a look at the Value Line Geometric Index and what it can tell us.
Note: The geometric index tracks the median index move if all stocks had an equal amount (say $100) invested in them. This is directly from the Valueline.com website on Geometric vs. Arithmetic Indexes.
“On June 30, 1961, we introduced the Value Line Composite Index. This market benchmark assumes equally weighted positions in every stock covered in The Value Line Investment Survey. That is, it is assumed that an equal dollar amount is invested in each and every stock. The returns from doing so are averaged geometrically every day across all the stocks inThe Survey and, consequently, this index is frequently referred to as the Value Line (Geometric) Average (VALUG). The VALUG was intended to provide a rough approximation of how the median stock in the Value Line universe performed.
On February 1, 1988, Value Line began publishing the Value Line (Arithmetic) Average (VALUA) to fill a need that had been conveyed to us by subscribers and investors. Like the VALUG, the VALUA is equally weighted. The difference is the mathematical technique used to calculate the daily change.
The VALUA provides an estimate of how an equal-dollar weighted portfolio of stocks will perform. Or, put another way, it tracks the performance of the average, rather than the median, stock in our universe. It can be shown mathematically, for all practical purposes, that the daily percentage price change of the VALUA will always be higher than the VALUG. The systematic understatement of returns of VALUG is a major reason that the VALUA was developed. Moreover, although the differences between daily price changes may seem small, the magnitude of the annual differential between the two averages can be very large. The greater the market volatility, the larger the spread between the geometric and arithmetic averages becomes.
~Tim McMahon, editor.
Stocks Inside Box Since 1982
The Value Line Geometric Index is a broad, equally-weighted index that can be used to monitor the health of the stock market beyond the capitalization-weighted S&P 500.
As shown in the monthly chart below, the orange box acted as both support (green arrows) and resistance (red arrows) several times between 1982 and 2016. At the end of February 2017, the Value Line Geometric Index closed above the orange box; a potentially bullish development from a long-term perspective.
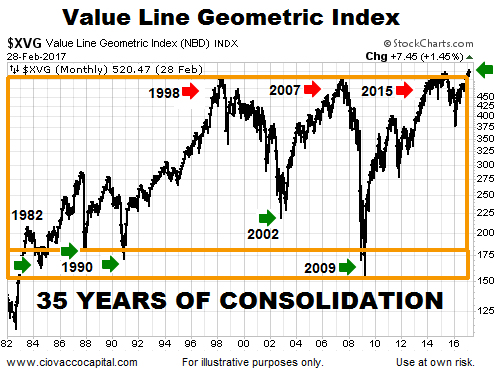
The concept of consolidation, or a rectangle, as outlined on StockCharts.com:
Rectangles represent a trading range that pits the bulls against the bears. As the price nears support, buyers step in and push the price higher. As the price nears resistance, bears take over and force the price lower. Nimble traders sometimes play these bounces by buying near support and selling near resistance. One group (bulls or bears) will exhaust itself and a winner will emerge when there is a breakout.
35 Years May Be Significant
From a longer-term perspective, if the breakout holds, the length of time the Value Line Geometric Index spent inside the box could be very significant. From StockCharts.com:
Generally, the longer the pattern, the more significant the breakout. A 3-month pattern might be expected to fulfill its breakout projection. However, a 6-month pattern might be expected to exceed its breakout target.
Reviewing The Breakout In Detail
This week’s stock market video covers two major developments, including the long-term breakout in the Value Line Geometric Index. The coverage of the Value Line Geometric Index begins at the 6:39 mark.


Time Will Tell If The Breakout Can Hold
Since breakouts can fail, we will not know the significance, or lack thereof, of the recent push above the orange box for several weeks or months. Breakouts are often retested, which also calls for an open mind in the coming weeks.
In terms of keeping an open mind about the breakout holding, other developments, including a turn in the True Strength Index and a Bollinger Band “price surge”, also lean bullish from a long-term perspective.
This article by Chris Ciovacco originally appeared here and was reprinted by permission.
Speak Your Mind