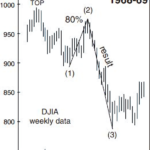
Elliott Wave
Free Tutorial
Decision Bar

Bear Market

See Prechter’s “FREE FALL TERRITORY” Chart for Yourself

And see EWI’s long-term forecast in the updated “Free Fall” chart

In the May 2008 issue of his monthly Elliott Wave Theorist, Robert Prechter showed this chart of the Dow Jones Industrials. As you can see, prices go back to the 1970s.

Please note that on the day this chart published (May 16), the Dow closed at 12,987 — barely eight percent below the Dow’s all-time high of the previous October.

Yet, as you can also clearly see, Prechter labeled the white space below the May 2008 price level as “Free Fall Territory.”

At the time, no one else dared to publish such a bearish forecast. This was before the Lehman bankruptcy, the bailout binge, the home foreclosure crisis, and certainly before the worst of the stock market collapse.

In his June 2011 Theorist, Prechter published an update to the chart above, and here’s the major difference: The updated chart “telescopes out” by one full degree of trend. Prices go back to the 1930s. The scale of the white space surrounding this chart’s “free fall territory” label will show you what Prechter truly means.

His commentary in that issue also observed that

“the March-April [2011] rally was one of the most passionate bouts of stock buying I have ever witnessed.”

Bob Prechter made this observation not in admiration, but as a warning.

In the past three weeks, the Dow Industrials have plummeted nearly 2,000 points. Most investors are confused and scared. How far down will the decline travel? Will it end tomorrow or go on for years? Read the rest of this entry »

Understanding Robert Prechter’s ‘Slope of Hope’

What's the opposite of climbing the "wall of worry"? Now is a good time to learn why it's called the slope of hope. Read the rest of this entry »

The Bear Market and Depression: How Close to the Bottom?

"People are more bearish than I have ever seen them. This has to be a bottom." The first half of this statement may well be true for many market observers. If one has been in the market for less than 14 years, one has never seen people this bearish. But 14 years is a short time. What about the past 100 years of stock market history? Read the rest of this entry »

20 Questions with Robert Prechter: Long Decline Ahead

The following article is an excerpt from Elliott Wave International’s free report, 20 Questions With Deflationist Robert Prechter. It has been adapted from Prechter’s June 19 appearance on Jim Puplava’s Financial Sense Newshour.

Jim Puplava: I want to come back to government spending, but first I want to move onto the stock market. In your last two Elliott Wave Theorist issues, you laid out a scenario that would put the Dow and S&P, which in your opinion may have peaked on April 26, as the top from here. You feel that this top is the biggest top formation of all time, a multi-century top and we could head straight down in a six-year collapse that would end in 2016 that could see a substantial portion of the S&P and the Dow wiped out in a similar way that we saw between 1929 and 1933. Let’s talk about that and the reasoning behind it. Read the rest of this entry »

How Might Gold, Silver and T-bonds Behave in a Bear Market?

Can you imagine a scenario under which precious metal and Treasury bond prices would fall together? Most people would think such an event would be impossible. Yet look at this chart and realize that gold and T-bonds have been going up together for an entire decade... Read the rest of this entry »

U.S. Stocks: Will The Bears Relinquish Control?

In case you were hiding out Tiger Woods' style far away from the mainstream media over last month, let me be the first to say: January saw an abrupt end to the US stock market's record-setting winning streak. Last count, the Dow Jones Industrial Average plummeted 4% in its worst monthly loss in a full year Read the rest of this entry »
News Feed

Enter your email address to subscribe to this blog and receive notifications of new posts by email.

Archives