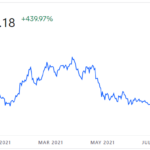
Over the last year, bitcoin has increased by over 400%. As a matter of fact, it has more than doubled since the July low. In today’s article, we are going to look at whether news or even government actions affect the price of bitcoin. In the article, it refers to a proclamation made on July 2, where Elliottwave International says that the downtrend was ending… and then Bitcoin rose throughout July and August, fell through September (bottoming on September 28th), and then it began to rise again. ~Tim McMahon, editor.
Elliott Wave Analysis: Where the RUBBER Meets the Road
February 14, 2017 by Leave a Comment
There are nearly 50 commodity markets traded all over the world at any given time. That’s one for every state in the United States. So, how is an investor or trader supposed to know which of these markets to follow and which ones to dismiss?
The 2 Most Important Keys to Successful Trading
June 20, 2013 by Leave a Comment
Examples from Whole Foods Market and Reynolds American, Inc show you what to do (or not) to trade successfully with Elliott Wave By Elliott Wave International After 20 years of experience applying the Elliott Wave Principle, Senior Analyst Jeffrey Kennedy says that it remains the one tool that will tell him — down to the […]
S&P Final Wave Up?
March 6, 2013 by Leave a Comment
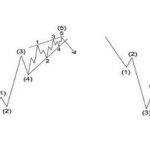
In the Elliott Wave model, market prices alternate between the primary trend (or impulsive) and the corrective phase. Impulse waves are always subdivided into a set of 5 lower-degree waves. Corrective waves subdivide into 3 smaller-degree waves. In a bull market the dominant direction is upward so the five waves would be upward. In a bear market […]
Don’t Trade Forex Looking in the Rearview Mirror
December 28, 2012 by
The foreign exchange (forex) market has a huge trading volume giving it high liquidity and making it the largest asset class in the world. Unlike individual exchanges like the London or New York stock exchange it is geographically diverse and operates continuously 24 hours a day (except on weekends). It also encompasses a variety of factors that affect exchange rates. It […]
Reading the Wave Analysis Map
December 17, 2012 by
Which Works Best — GPS or Road Map? (Part 2) Trading with Elliott wave analysis By Elliott Wave International (Part 1 of this article is posted here.) A Quick Road Map of Wave Analysis For this overview of wave analysis, I have borrowed from the “Cliffs Notes” version that we provide for free to anyone […]
Elliott Wave Trading Q&A
August 8, 2012 by
Tips on technical indicators and how to improve your trading. By Elliott Wave International There’s no shortage of actionable trading information out there, for every kind of trading style — countless newsletters, books, and websites to choose from. But how do you know when to apply this information to your trades? If you’re an experienced […]
Spotting Elliott WaveTrades- Charts and Video
July 22, 2012 by
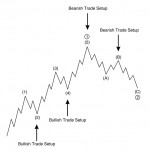
By Elliott Wave International You can find low-risk, high-confidence trading opportunities by trading with the trend. The trick is to find the end of market corrections, so you can position yourself for the next move in the direction of the trend. On the left-hand side of the illustration below, there are two bullish trade setups. […]
Diagonal: Straight Shot to a Trading Opportunity
April 5, 2012 by Leave a Comment
Today we sit down with Elliott Wave International’s Futures Junctures Editor and Senior Tutorial Instructor Jeffrey Kennedy to discuss his favorite wave pattern of all: the diagonal. EWI: You say if you had to pick just ONE of all 13 known Elliott wave structures to spend the rest of your technical trading life with, it […]
Learn Elliott Wave Analysis — Free
December 16, 2011 by Leave a Comment
Understand the basics of the subject matter, break it down to its smallest parts — and you’ve laid a good foundation for proper application of… well, anything, really. That’s what we had in mind when we put together our free 10-lesson online Basic Elliott Wave Tutorial, based largely on Robert Prechter’s classic “Elliott Wave Principle […]