Prior to February 5th the market had gotten a bit complacent. It had one of the longest bull runs without a significant pullback in recent memory. All that bullishness led to low volatility and made investors lazy and less vigilant. But Elliott Wave International readers should have known better. The market can’t go straight up forever, it needs periods of consolidation to shake out the “weak hands” and build a more solid foundation as it climbs. OK. So, what now? Is this 10% drop in the Dow a buying opportunity — or the big reversal? See the following article for more insight.~Tim McMahon, editor.
Buy or Sell? This Insight May Help You Decide
It’s a tough decision. We’d like to help by showing you some unconventional market evidence.
By Elliott Wave International
By February of this year, investors had almost forgotten what stock market volatility looked like.
And then something unprecedented happened. On Monday, Feb. 5, the DJIA closed 1,175 points down, the biggest single-day drop in the index’s history. Since then, stocks have been going haywire.
Was this spike in volatility unpredictable? Hardly. Our December 2017 Financial Forecast warned:
The CBOE Volatility Index declined to 8.56 intraday on Nov. 24, the lowest level in its 30-year history… As we’ve noted, the most placid periods of stock market activity are invariably followed by episodes of extreme volatility…
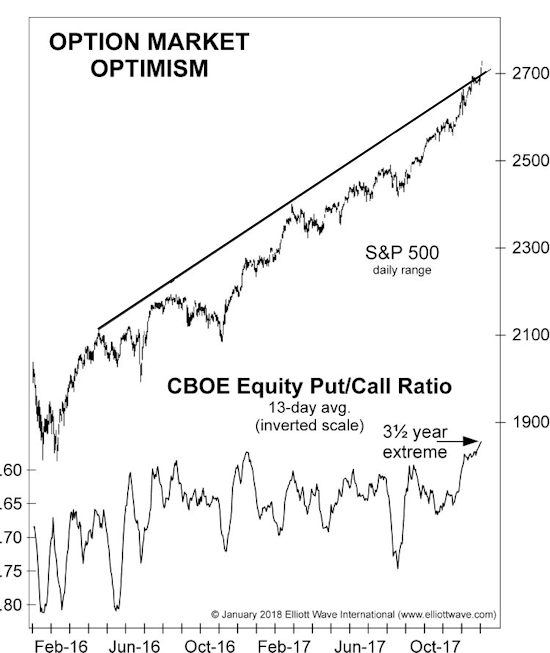
Sentiment measures had also been sounding an alarm. Here’s just one chart, from our January 2018 Financial Forecast (Elliott wave-labeled version reserved for subscribers):
The chart of the 13-day CBOE equity put/call ratio shows that it has declined to .55, with the volume of calls nearly double the volume of puts. Options traders have not been this optimistic in 3½ years. So, trader sentiment is consistent with the optimism of fund managers, hedge fund operators and even the “little guys.”
History shows that such optimistic extremes are contrarian indicators. Investors who heeded these warnings were not surprised by the volatility eruption — indeed, they expected it.
OK. So, what now? It this 10% drop in the Dow a buying opportunity — or the big reversal?
This is the big question, and the mainstream view is clearly leaning towards the bullish view:
- 10 Blue-Chip Stocks to Put on Your “Buy the Dip” List — (Kiplinger, Feb. 2)
- 3 Stocks to Buy When the Market Crashes — (The Motley Fool, Feb. 5)
- Now is the time to buy equities… says CIO — (CNBC, Feb. 5)
Market optimists may turn out to be correct. Maybe it’s just a bump in the road.
Then again, maybe sentiment measures continue to tell another story.
EWI’s Robert Folsom just posted a special video titled “More Bullish Than Ever.”
Then, make up your own mind about the bullish or bearish prospects for the stock market.
The URGENCY of Up-to-Date Stock Market Sentiment
The February 2018 Elliott Wave Financial Forecast Short Term Update said this:
We know from our own experiences how tough a taskmaster Mr. Market is, which is why we constantly point out the importance of sentiment extremes in the context of a progressing Elliott wave structure.
With that in mind — our just-produced video delivers the sentiment readings that you need to know about NOW.
HINT: Near the video’s beginning, you’ll learn about a market-related event in January 2018 that is jaw-droppingly similar to a development that unfolded in February 2000 — yes, around the time of the historic stock market top of that year.
This article was syndicated by Elliott Wave International and was originally published under the headline Buy or Sell? This Insight May Help You Decide. EWI is the world’s largest market forecasting firm. Its staff of full-time analysts led by Chartered Market Technician Robert Prechter provides 24-hour-a-day market analysis to institutional and private investors around the world.

Speak Your Mind