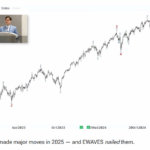
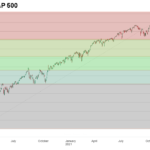
It’s not easy to forecast the twists and turns in the S&P 500 — but this video shows how the EWAVES engine did exactly that.
Five Benefits of Using the Elliott Wave Principle to Make Decisions
December 9, 2024 by Leave a Comment
While everyone searches for the Holy Grail of forecasting, which does not exist, there is one method of analysis that stands apart from the slew of momentum-based indicators, all of which by definition lag the market. The Elliott Wave Principle is based on the concept that crowd behavior is patterned and that these patterns are easily discerned in the prices of freely traded markets. This alone sets it apart in the world of technical analysis.
Quick Takes on Big Financial Trends
July 27, 2023 by Leave a Comment
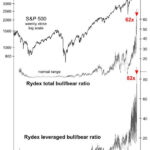
Sentiment indicators… can tell you the extent to which [people] are extremely optimistic or pessimistic. Well, 2021 was a year like no other. Finally, in December 2021, I put out an issue called “A Stock Market Top for the Ages.”
Where is the Market Headed in May 2023
May 23, 2023 by Leave a Comment
As we’ve been saying for a while now, the market is stuck in a pennant formation and will eventually have to break out one way or the other, and generally, when that type of breakout occurs, it is quite sharp.
The Dow 8 Waves are Incomplete
June 15, 2022 by Leave a Comment
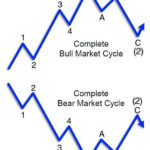
According to Elliott Wave Theory, each cycle is comprised of 8 waves. Each wave is comprised of smaller cycles. Cycles can take days, weeks, months, years, decades, or even centuries to complete. Now is the time to prepare for the completion of the biggest cycle.
Germany’s DAX: What You Can Learn from the 2007 Top
April 7, 2022 by Leave a Comment
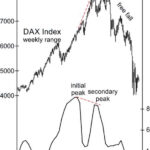
This stock market indicator may be off many investors’ radar but a peak in consumer confidence tends to precede a peak in the stock market. With that in mind, back on Nov. 25, the Telegraph said: Consumer confidence has dropped sharply in Germany. … A few days later, the December Global Market Perspective, a monthly Elliott Wave International publication that offers coverage of 50-plus worldwide financial markets, provided a retrospective of Germany’s DAX and consumer confidence with this chart and commentary:
The Journey to High-Confidence Trading Starts Now!
March 21, 2022 by Leave a Comment
Next Stop: Corrective Elliott Wave Patterns
Soybeans and Apple stock (AAPL): Corrective patterns signaled opportunities in these disparate markets. Your market could be next!
By Elliott Wave International
The last 2 years have been a time of immense global adversity with the most challenging human health crisis in over a century.
But it has also been a time of immense personal growth. The uncomfortable realization of our dependence on others for everything from entertainment, education, nourishment, and income came into stark, swift focus. And with it, how quickly those things can be taken away without warning because of that dependence.
In turn, the pandemic saw an insatiable industry of online self-improvement crash courses emerge on home garden horticulture, podcast making, home building, home schooling, and — learning to trade financial markets to “ensure a steady livelihood despite economic setbacks.”
The problem is, learning to trade isn’t like learning to plant tubers in your backyard. It’s much more complicated and can’t be fully conveyed with mock “trials” or simulated positions. At best, many of such courses get people in the door, but not seated at the table of real-world practice and risk-management.
That’s where our respected partner Elliott Wave International (EWI) comes in. Its team of market analysts and technical analysis instructors has committed itself to leading the most comprehensive educational journey of the company’s 42-year long history.
EWI’s ultimate goal for 2022: Empower market newbies and veterans alike to develop and deepen their opportunity-spotting skills through the independent forecasting model known as Elliott wave analysis.
In brief, Elliott wave analysis, aka the Wave Principle, is founded on these core observations:
Market trends are driven by trends in collective investor psychology
Investor psychology progresses in 2 modes, impulsive and corrective
Correctly identifying these patterns at their onset illuminates future price action
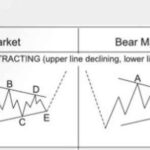
One such mode of market progress is the correction, which is best defined by the “bible” of all things Elliott, Elliott Wave Principle — Key to Market Behavior:
“Markets move against the trend of one greater degree only with a seeming struggle. Resistance from the larger trend appears to prevent a correction from developing a full motive structure… Specific corrective patterns fall into three main categories: Zigzag, flat and triangle.”
Is the Correction Over?
January 27, 2022 by Leave a Comment
After a fairly rapid correction in January 2022, the market has started to rebound. So does that mean it’s safe to jump back into the market? After all, we saw a worse crash in January 2020 followed by a rapid rebound to new highs. And even the 2018 correction was short-lived. So have market participants become accustomed to quick rebounds? Or is this just a brief counter-trend rally?
Euro: Look at This Head & Shoulders Chart Formation
December 23, 2021 by Leave a Comment
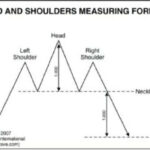
You are probably familiar with the classic “head and shoulders” chart pattern. But, in case you need a refresher, here’s a brief description of a head and shoulders top: The high of an initial upward move is the left shoulder. After a decline, another upward move takes prices to a higher high, or the head. A second decline follows the head. A third rally then takes prices to a peak below the high of the head, and becomes the right shoulder. The left and right shoulders are often similar in duration and extent. A trendline connecting the two lows is called the neckline. When prices penetrate the neckline, a change of trend is believed to have occurred. Head and shoulders bottoms also occur and the same description applies except in reverse. This head and shoulders measuring formula — showing a top as an example — provides even more insight. The commentary is from a past issue of Elliott Wave International’s Trader’s Classroom:
“Kiss of Death” Stock Market Indicator
September 13, 2021 by Leave a Comment
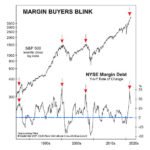
Government regulations require the disclaimer that “Past Performance is not a Guarantee of Future Results” but certain events tend to trigger other events. Or if they don’t trigger them they have similar causes or perhaps one is just an indicator that the other is in progress. Wise stock investors are always on the lookout for these types of indicators so they can be properly invested for the upcoming event. In today’s article, we are going to look at an indicator that often (not always) precursors a market crash.