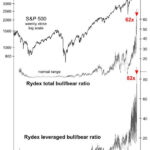
Sentiment indicators… can tell you the extent to which [people] are extremely optimistic or pessimistic. Well, 2021 was a year like no other. Finally, in December 2021, I put out an issue called “A Stock Market Top for the Ages.”
Stocks and Junk Bonds: “This Divergence Appears Meaningful”
June 28, 2023 by Leave a Comment
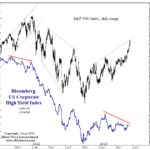
The trends of the junk bond and stock markets tend to be correlated.
The reason why is that junk bonds and stocks are closely affiliated in the pecking order of creditors in case of default. The rank of junk bonds is only slightly higher than equities because debt involves a contract.
Given these two markets are usually correlated, it’s worth paying attention when a divergence takes place. Indeed, a divergence is in the works now. In other words, while stocks have been holding up, the price of junk bonds have been trending lower for much of the year.
Seeking Certainty in Uncertain Times?
July 10, 2020 by Leave a Comment
What seems like ages ago but in reality was just the beginning of this year… life was simple. The market was humming along, unemployment was at record lows, inflation was moderate and life was good. And now just a few months later, there are riots in the streets, unemployment is at record highs, and people are filling up the hospital’s ICUs.
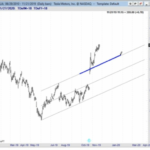
Over the years, we have experienced many ups and downs but rarely in such close succession. But our first line of defense is always the “trendline” (no pun intended). A trendline can tell you both the market direction and its parameters. And if you have read much of what we do, both here and at Financial Trend Forecaster you will know that understanding the trend and using trendlines is a key part of our function.
Charts Say Stocks Could Rise For 10-15 Years
August 1, 2018 by Leave a Comment
With busy lives and a constant barrage of new information, many investors have a somewhat limited view of history from a financial markets/economic/political perspective. Albert Einstein reminds us of the benefits of taking a step back to review the bigger picture in a longer-term historical context:
“Somebody who only reads newspapers and at best books of contemporary authors looks to me like an extremely nearsighted person who scorns eyeglasses. He is completely dependent on the prejudices and fashions of his times, since he never gets to see or hear anything else.” Albert Einstein
How Does 2016 Compare To Stock Market Peaks In 2000 And 2007?
August 15, 2016 by Leave a Comment
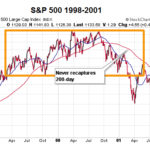
How does the current 50 day and 200 day moving average on the S&P 500 compare from previous crashes with the current market situation?
Using Trend Lines and Identifying Support and Resistance
January 12, 2015 by 2 Comments
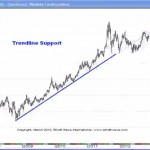
One of the most basic skills necessary when looking at a stock chart is using trend lines and identifying support and resistance. Unfortunately, sometimes as we learn more sophisticated methods we tend to forget the basics. So if you are just starting in the markets or you are a more advanced trader, you may find this information valuable.
The Non-linearity of Market Trends, and Space Programs
August 22, 2013 by Leave a Comment

Linear projections will often take you down the wrong path By Elliott Wave International Let’s begin with the old paradox: “The only constant is change.” This is the main reason why projecting present conditions into the financial future so often fails. If someone had asked you in 1972 to project the future of China, would […]
Bulls are Still in Control- Yellow Flags Raised
January 24, 2013 by Leave a Comment
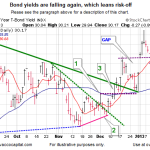
As of the close Tuesday, the bulls remained in control, but there are reasons to pay attention this week with an open mind: Bond yields are falling, which leans risk-off. The ratio of stocks vs. the VIX is facing overhead resistance. The ratio of stocks vs. bonds has stalled. The European economy remains vulnerable. Bond […]