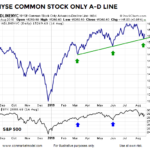
During the trading session on Monday, August 19, the “bottoming process” case for the stock market remained intact. The NYSE Common Stock A-D Line held the line last week at a logical level associated with the S&P 500 reversals in March and June (chart below).
When Prices Are Falling, TWO Numbers Matter Most
July 22, 2017 by Leave a Comment
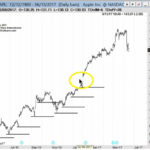
On June 29, the Apple iPhone turned 10 years old. But, for many, the mood surrounding the milestone was less than celebratory. Reason being, in June alone, Apple Inc. (AAPL) plunged 6% to two-month lows amidst a broad-scale bruising of the global tech sector.
Retesting Market Lows Seeking Support
September 28, 2015 by Leave a Comment
Given the severity of the selloff in stocks in late August, it was not surprising to see the subsequent rally attempts fail. As we noted numerous times in recent weeks, including September 3 and September 17, bottoms tend to be a process.
Using Trend Lines and Identifying Support and Resistance
January 12, 2015 by 2 Comments

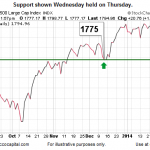
One of the most basic skills necessary when looking at a stock chart is using trend lines and identifying support and resistance. Unfortunately, sometimes as we learn more sophisticated methods we tend to forget the basics. So if you are just starting in the markets or you are a more advanced trader, you may find this information valuable.
Flexibility Important During Indecisive Periods
January 31, 2014 by Leave a Comment
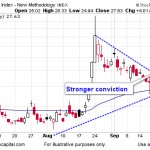
The Fundamentals are Reflected in the Charts The market’s pricing mechanism, is based on the aggregate opinion of every investor around the globe and thus allows us to compare economic confidence in late 2007 to the present day. A more direct way to say it is “charts enable us to monitor the conviction that stocks […]