Stocks Don’t Go Straight Up (or Straight Down)

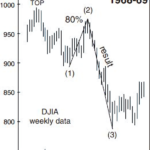
Big stock market trends don’t progress up or down in a straight line. In a bear market, stocks typically rebound after the first leg down. In a bull market, the opposite happens: Stocks again take a big dive, making everyone think the bear market has returned.

But in a bear market, that “first leg down” is wave 1 and the partial “rebound” which follows is wave 2. I say “partial” because the only rule which applies to wave 2 is that it cannot retrace 100% of wave 1. Meaning, the bear market rally cannot go above the previous market top.
How to Prepare for a Hard-Hitting Bear Market (Think 1929-1932)

An important step in preparing for a historic bear market is to embrace cash or cash equivalents.
This may seem obvious, but even with the stock market in a downtrend, cash is shunned by many an investor — retail and professional. Many of these investors believe the bull market will resume — sooner rather than later.

Could The S&P 500 Fall To 1,625?

A Trip Down Correction Memory Lane Since the correction-less market theory has been dropping transmission parts over the last three weeks, it is prudent to revisit some topics we have touched on in the past. We will focus on two questions: How far can stocks drop? How long can corrections last? History Says Corrections Can […]

Beware of Bears

The bearish case is beginning to make more and more sense. In my recent NASDAQ ROC stock commentary I warned that based on age alone the bull market is getting “long of tooth” and could generate a sell signal soon. And then we had Obama’s Comments Worry Stock Bulls showing how recent rhetoric by the President […]

Prechter: “This is Not a Picture of a Bull Market”

The three-and-a-half-year rally has occurred on declining volume By Elliott Wave International What a comeback for the Dow Industrials! From a March 9, 2009, close of 6,547, the senior index climbed to 13,610 on Oct. 5, 2012. Moreover, the Dow achieved this feat in the face of a weak-kneed economy, and it has grinded forward […]

See Prechter’s “FREE FALL TERRITORY” Chart for Yourself

And see EWI’s long-term forecast in the updated “Free Fall” chart In the May 2008 issue of his monthly Elliott Wave Theorist, Robert Prechter showed this chart of the Dow Jones Industrials. As you can see, prices go back to the 1970s. Please note that on the day this chart published (May 16), the Dow […]

Understanding Robert Prechter’s ‘Slope of Hope’

What’s the opposite of climbing the “wall of worry”? Now is a good time to learn why it’s called the slope of hope.

The Bear Market and Depression: How Close to the Bottom?

“People are more bearish than I have ever seen them. This has to be a bottom.” The first half of this statement may well be true for many market observers. If one has been in the market for less than 14 years, one has never seen people this bearish. But 14 years is a short time. What about the past 100 years of stock market history?

20 Questions with Robert Prechter: Long Decline Ahead

The following article is an excerpt from Elliott Wave International’s free report, 20 Questions With Deflationist Robert Prechter. It has been adapted from Prechter’s June 19 appearance on Jim Puplava’s Financial Sense Newshour. Jim Puplava: I want to come back to government spending, but first I want to move onto the stock market. In your […]

How Might Gold, Silver and T-bonds Behave in a Bear Market?

Can you imagine a scenario under which precious metal and Treasury bond prices would fall together? Most people would think such an event would be impossible. Yet look at this chart and realize that gold and T-bonds have been going up together for an entire decade…