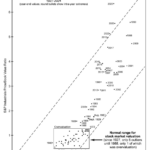
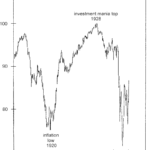
I thought the year-end 2021 overvaluation would never be surpassed. But as you can see, the year-end 2024 reading is both higher and further to the right. It is the highest multiple ever recorded for S&P Industrials’ price to book value and the fifth-lowest level for the S&P Composite’s dividend yield, the four lower readings all occurring in 1998-2001.
Stocks and Junk Bonds: “This Divergence Appears Meaningful”
June 28, 2023 by Leave a Comment
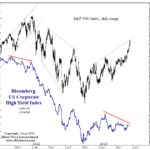
The trends of the junk bond and stock markets tend to be correlated.
The reason why is that junk bonds and stocks are closely affiliated in the pecking order of creditors in case of default. The rank of junk bonds is only slightly higher than equities because debt involves a contract.
Given these two markets are usually correlated, it’s worth paying attention when a divergence takes place. Indeed, a divergence is in the works now. In other words, while stocks have been holding up, the price of junk bonds have been trending lower for much of the year.
60% stocks, 40% bonds? Ha!
December 21, 2022 by 2 Comments
Traditional wisdom suggests a quick and easy “Balanced Portfolio” of 60% stocks and 40% bonds. But there are pitfalls to this type of quick and dirty balancing. Theoretically, when stocks fall, bonds should rise or at least maintain their value. More advanced balancing systems might add a Gold or precious metals component of perhaps 10%. Still, further refinement can decrease the stock portion and increase the bond portion as you get closer to retirement age. On average, a 20-year-old has a lot longer to recover from a market downturn than an 80-year-old. So, a younger person can accept higher risk in return for a higher reward, so a 20-year-old might have 80% in stocks and 20% in bonds. An 80-year-old, on the other hand, might have 80% in Bonds and 20% in stocks. In the following article, the Editors at Elliott Wave International look at some of the pitfalls of the balanced portfolio approach. ~ Tim McMahon, editor
Stocks Don’t Go Straight Up (or Straight Down)
September 1, 2022 by Leave a Comment
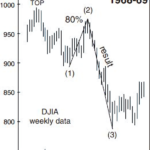
Big stock market trends don’t progress up or down in a straight line. In a bear market, stocks typically rebound after the first leg down. In a bull market, the opposite happens: Stocks again take a big dive, making everyone think the bear market has returned.
But in a bear market, that “first leg down” is wave 1 and the partial “rebound” which follows is wave 2. I say “partial” because the only rule which applies to wave 2 is that it cannot retrace 100% of wave 1. Meaning, the bear market rally cannot go above the previous market top.
Why the “60 / 40 Balance” May Be Hazardous to Your Portfolio
February 17, 2022 by Leave a Comment
Financial advisors have long advocated a mix of 60% stocks / 40% bonds to cushion portfolios from downturns in the stock market. The thinking is that stocks go up in the long-term, hence, that’s where investors should allocate the most. At the same time, advisors acknowledge that stock prices can sometimes go down so “less risky” bonds will provide at least some protection. The problem with this investment strategy is that bonds can go into bear markets too. Moreover, they can do so at the same time as stocks. Let’s review what happened during the Great Depression of the early 1930s.
Secrets To Maintain A Healthy Trading Psychology
November 15, 2021 by Leave a Comment

Two of the greatest motivators in the financial arena are Fear and Greed. Unfortunately, many traders fall victim to their enticement and end up making disastrous mistakes. But by getting your emotions under control you can follow the sage advice of Warren Buffet and “Be fearful when others are greedy and greedy when others are fearful”.
Are Investors “Courting Doom”?
April 29, 2021 by Leave a Comment
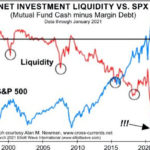
Since the start of the pandemic, millions of people have opened trading accounts. Perhaps, you have as well. When stocks only go up – as they have over the past year – trading seems easy. That’s why many traders today use lots of margin debt. And why not? Borrowing to buy stocks can work out well during an uptrend. Yet, highly leveraged portfolios can be deeply wounded during a fast-moving downtrend. When this bull run ends, we’ll hear lots of stories about traders who got caught completely unprepared. Don’t let it happen to you.
Did the Oil Crash Wreck the Stock Market?
March 12, 2020 by Leave a Comment
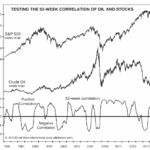
Crude oil took a 30% dive on Sunday, March 8. Yet what’s happened in oil this year is so much bigger than that headline-grabbing, one-day move. In January, oil was $64 a barrel. It hit $27.34 intraday on Monday, March 9, so the price of oil fell 57% in just two months. Talk about a swift decline.
Bullish Signal Has Only Happened 10 Times in the Last 94 Years.
November 7, 2019 by Leave a Comment
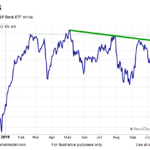
In today’s article by Chris Ciovacco of Ciovacco Capital Management Chris looks at a Bullish Signal that has only happened 10 times in the last 90 Years. Plus 8 charts that show a bullish break upward through resistance.
Trade, Impeachment, and the Conviction of Buyers and Sellers
October 2, 2019 by Leave a Comment
The following article by Chris Ciovacco looks at the impact the possibility of impeachment is having and could have on the stock market.