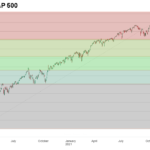
After a fairly rapid correction in January 2022, the market has started to rebound. So does that mean it’s safe to jump back into the market? After all, we saw a worse crash in January 2020 followed by a rapid rebound to new highs. And even the 2018 correction was short-lived. So have market participants become accustomed to quick rebounds? Or is this just a brief counter-trend rally?
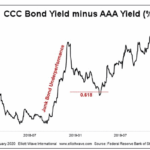
Junk Bonds: 2 “Golden” Junctures
March 28, 2020 by Leave a Comment
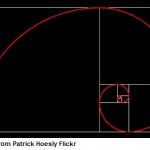
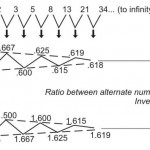
The Golden Ratio — 1.618 or .618 — is ubiquitous throughout nature. You’ll find this mathematical proportion in the shapes of galaxies, sea horses, pine cones, the arrangement of seeds on a sunflower head, and numerous other natural phenomena… including the chart patterns of financial markets.
Fibonacci Levels Create Key Support for S&P 500
January 30, 2015 by 1 Comment
Math plays a big role in nature and the financial markets. Many trading algorithms use Fibonacci retracement levels to identify areas where buyers may become interested (support). The math below may be helpful to us in the coming days – at a minimum, it is prudent to be aware of the possibility of a bounce near 1976 should the market test that area:
How to Find Trading Opportunities in ANY Market: Fibonacci Analysis
September 17, 2014 by Leave a Comment
The primary Fibonacci ratios that I use in identifying wave retracements are .236, .382, .500, .618 and .786. Some of you might say that .500 and .786 are not Fibonacci ratios; well, it’s all in the math. If you divide the second month of Leonardo’s rabbit example by the third month, the answer is .500, 1 divided by 2; .786 is simply the square root of .618.
How to Identify Turning Points in Your Charts Using Fibonacci
November 1, 2013 by Leave a Comment
Leonardo Fibonacci (aka. Leonardo of Pisa) was the son of a merchant and well educated in the use of numbers while keeping his father’s books but in those days all of Europe used “Roman Numerals” and calculations were difficult. Leonardo was instrumental in bringing the Arabic numeral that we use today to Europe. But although […]
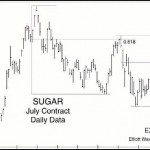
Fibonacci Clusters Show Important Resistance Level in Gold
May 4, 2013 by 1 Comment
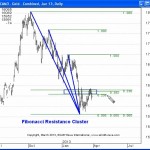
Senior Analyst Jeffrey Kennedy shares techniques that helped spot a trading opportunity. By Elliott Wave International If you use Elliott in your technical analysis, you may already use Fibonacci ratios to determine targets and retracement levels in your charts. But have you heard of “Fibonacci Clusters?” Elliott Wave Junctures editor Jeffrey Kennedy shares his charts […]
The Gartley Fibonacci Butterfly Price Pattern and the Butterfly Put
December 22, 2012 by
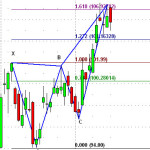
The following article was written by J.W. Jones and originally published in Options Trading Signals. It explains not only the Gartley Fibonacci Bearish Butterfly Price Pattern but how to trade it using a put butterfly option configuration. What exactly is a Gartley Fibonacci Bearish Butterfly, you might ask? Well read on and you will find out. […]
Fibonacci in Nature
October 11, 2012 by
Leonardo Fibonacci (aka. Leonardo of Pisa) was the son of a merchant working at a trading post in North Africa. At the time most of Europe was using Roman numerals which proved cumbersome when trying to add or subtract and keep the business’ books. Leonardo recognized that the Arabic numerals used in Africa were much […]