After a fairly rapid correction in January 2022, the market has started to rebound. So does that mean it’s safe to jump back into the market? After all, we saw a worse crash in January 2020, followed by a rapid rebound to new highs. And even the 2018 correction was short-lived. So have market participants become accustomed to quick rebounds? Or is this just a brief counter-trend rally?
Fibonacci Retracements
One of the standard charts that many traders look at is the Fibonacci retracement chart. It is drawn from a low to a high. The chart then generates “Fibonacci levels of 24%, 38%, 50%, and 62%. The idea is that these levels are common areas where a correction will reverse itself based on patterns in nature. The following chart shows the Fibonacci levels based on 2021 lows.
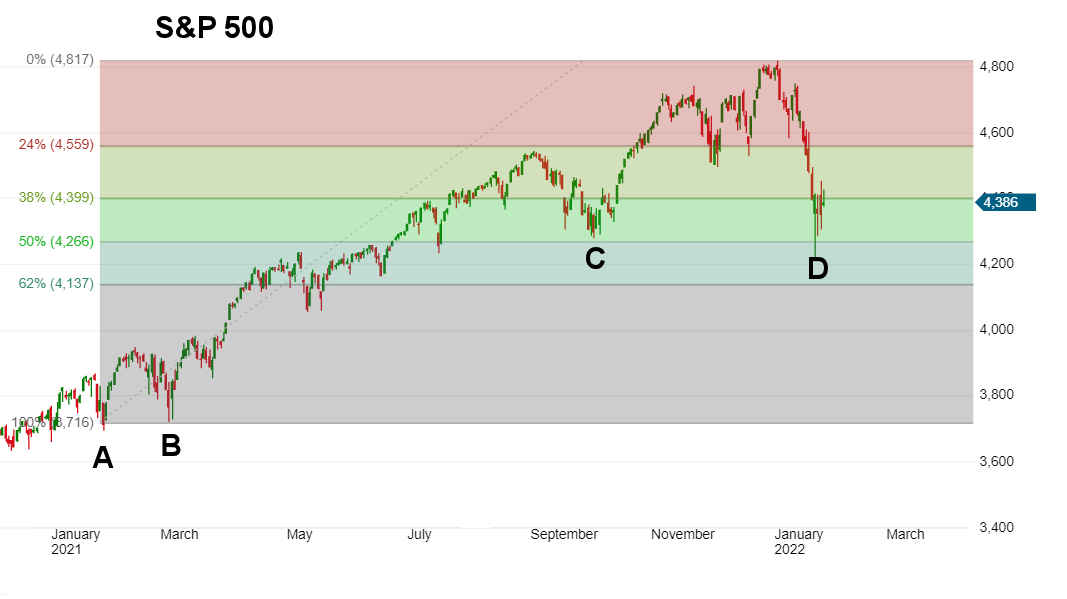
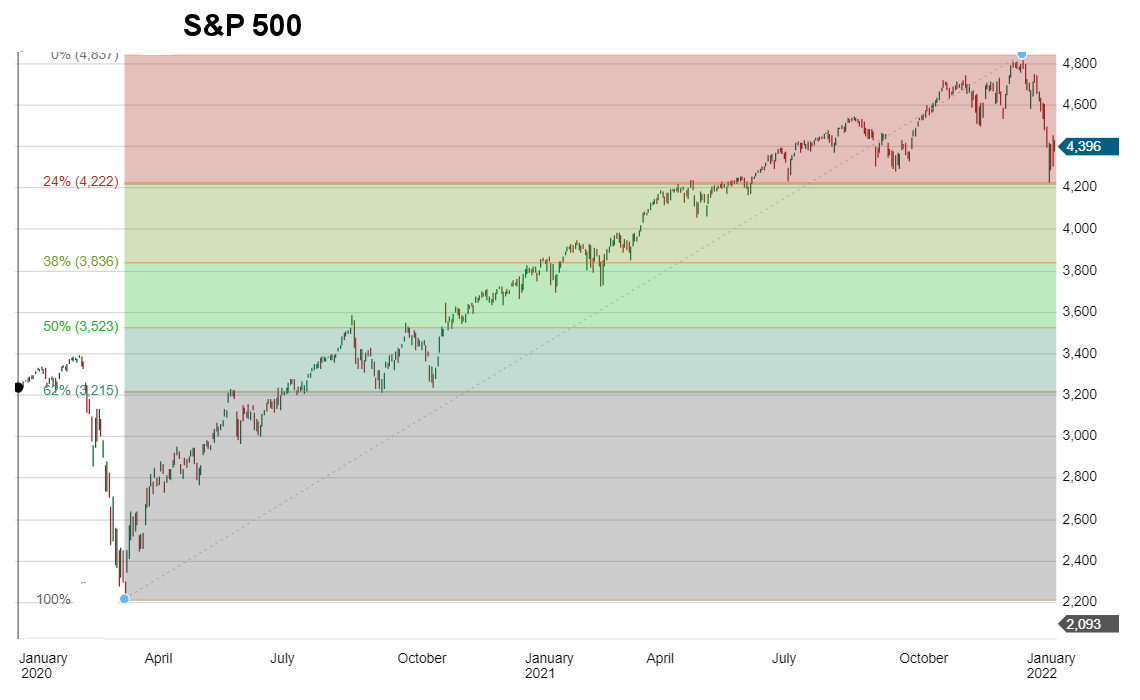
Early in 2021, the S&P 500 made two lows around 3700. A year later, the S&P 500 was around 4,800. Based on those levels, point “D” i.e., the most recent correction, was at the 50% level. This could be a validation of the Fibonacci method or simply a self-fulfilling prophesy. Either way, it doesn’t mean that we have seen the last of this correction. If we draw the Fibonacci levels from the bottom of the 2020 retracement, we see an entirely different picture. In this case, it is only a 24% retracement and has tested the September/October 2021 lows but is nowhere near the 50% or 62% levels. A 50% retracement would take the S&P 500 down to around 3,500 and a 62% retracement would take it down to 3,200.
A 50% Retracement is Not a 50% Loss
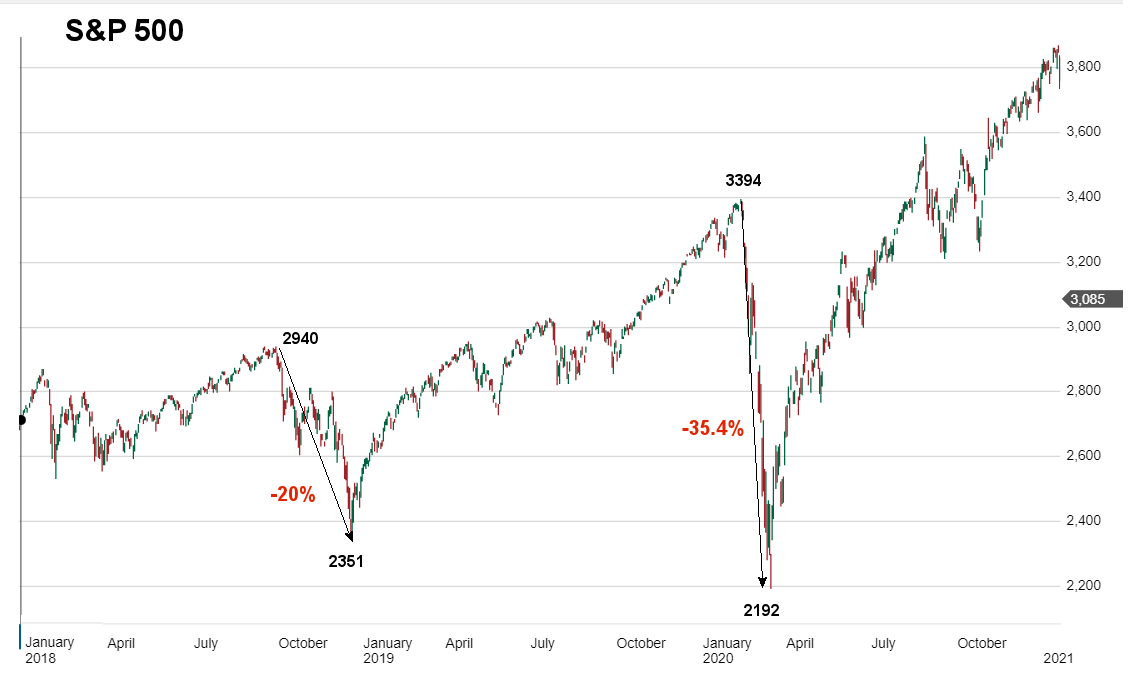
The next thing to remember is that a 50% Fibonacci retracement is not a 50% loss. A 50% Fibonacci retracement simply gives back half of the gain measured. In 2008, the market lost half of its total value, not just half of its recent gain. So let’s look at some recent corrections and their percentage losses (based on total market value). In the following chart, we can see that in 2018, from September through year-end, the market had a 20% correction. Typically, during a long-term bull market, we will see several counter-trend corrections of 10%, 20%, and even 30%. So the 2018 correction, although scary at the time, was just par for the course. However, the COVID correction of 2020 was over 35%, which makes it an outlier.
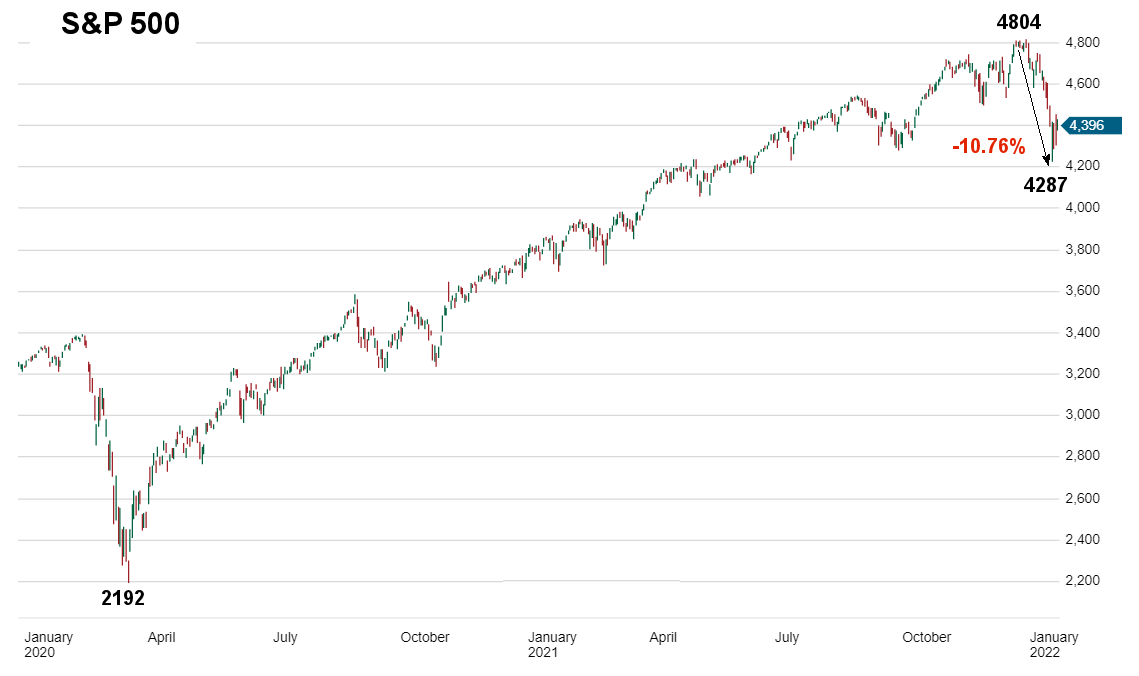
Looking at the 2022 correction so far, we see that it was only a little over a 10% correction. Very minor and might be considered a mere “temper tantrum” by the market because of the FED threatening to cut off the easy money that has propelled the market since the COVID crash.
The current rebound could be the result of bargain hunters assuming the market will behave similarly to the two previous corrections or program traders relying on the first Fibonacci chart. Markets rarely crash all at once. This is just the first test of support levels from September 2021. If a normal progression is followed, the market will rise to previous lows (around 4500), then fall through current support, then perhaps test the 4,000 (-16.7%) or 3,800 (-20.9%) support before rebounding. Final support could be as low as 3,400 (-29%) or even 2,200 (-54%). Remember, Fibonacci 62% was at the 3,200 level (-33.4%) .
Underlying Factors (The Big Picture)
When investing, it is essential to not only look at recent events but also at the big picture. The 500-pound gorilla in the room is always the FED. Since the 2008 crash, the FED has mainly been accommodative (thus the long-term up-trend in the market). The one time the FED decided to do some mild interest rate hikes, and Quantitative Tightening (QT) was in 2018. The FED began raising interest rates early in 2018 and not only stopped Quantitative Easing but actually began cutting its balance sheet, i.e., QT. It took about 10 months for the market to start correcting, but then it fell sharply. The following chart shows that the 2018 QT was much more gradual than any of the QEs except perhaps QE2.
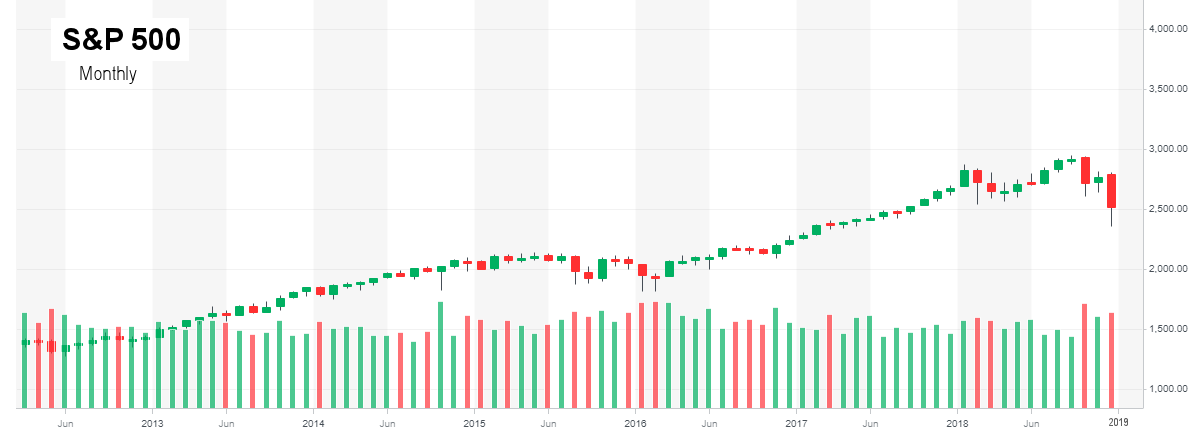
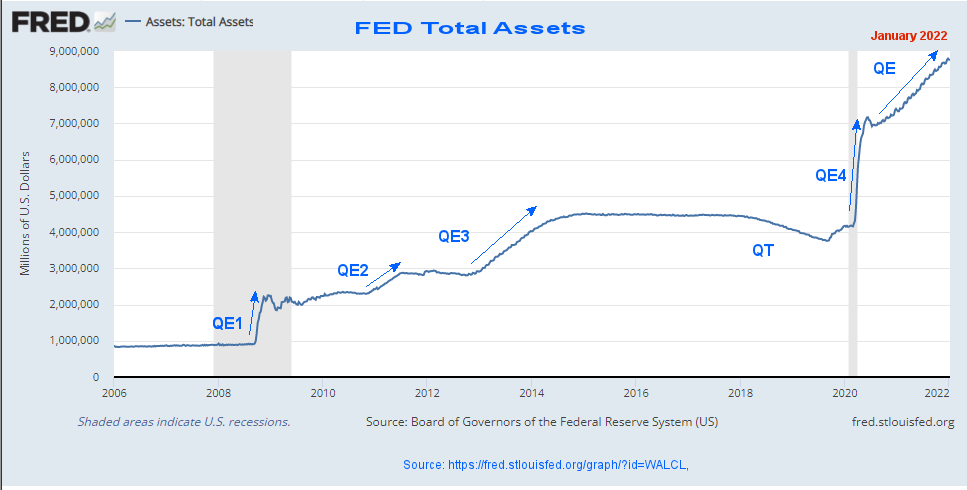 If we look at stock market performance from 2013 to 2018, we see a slight increase in 2013 at about the same time as QE3. Then the market is relatively flat until 2017. And then a drop corresponding to the FED’s tightening in 2018. The only time the market was rising without FED pumping was in 2017, after the FED had left the market alone for several years and the economy was on the mend.
Conclusion:
So, where does that leave us now? The FED has finally decided to combat inflation (a bit late in my estimation) and has promised to stop its Quantitative Easing by the end of February. So at this point, the money is still flowing. Therefore, the current correction isn’t the result of decreased money pumping but rather in anticipation of cutting off the supply. If 2018 is any indication, it takes about 10 months of reduction for the market to feel the effects. So the market could easily rebound from here back to previous highs or even a bit higher. Then it could bump along showing increased signs of weakness for several months before the bottom truly falls out.
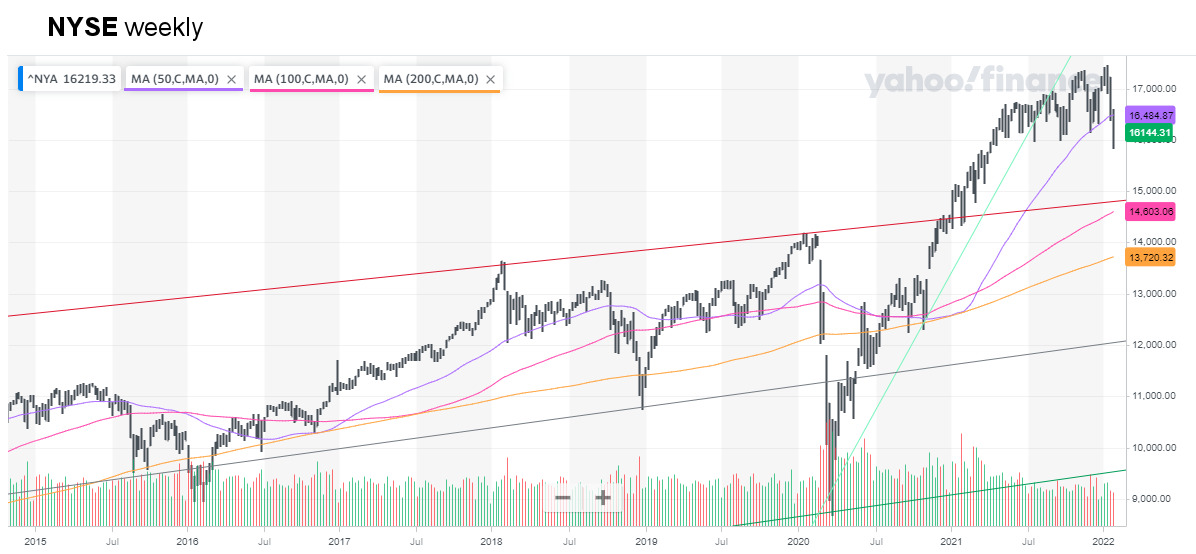
Looking at the weekly NYSE chart above, we can see that the market is still WAAAY above its long-term channel, and it has crossed below its 50-week moving average (MA). But the 50-week MA is still above the 100-week MA, which is still above the 200-week MA. So there is lots of room for sideways movement before we see a confirmed change from the long-term Bull Market. However, there are warning signs that the end is coming. A lot depends on how the FED handles it.
In the following video, Chris Ciovacco of Ciovacco Capital Management gives a bit of a Bullish spin on the current situation. Perhaps, lending some credence to the 9-10 month lag before the actual crash is confirmed.
See: NYSE ROC for more market analysis.
More Fibonacci Articles:
How to Find Trading Opportunities in ANY Market: Fibonacci Analysis
How to Identify Turning Points in Your Charts Using Fibonacci
Speak Your Mind