Leonardo Fibonacci (aka. Leonardo of Pisa) was the son of a merchant and well educated in the use of numbers while keeping his father’s books but in those days all of Europe used “Roman Numerals” and calculations were difficult. Leonardo was instrumental in bringing the Arabic numeral that we use today to Europe. But although this major contribution is largely forgotten stock market participants remember Fibonacci for a more unique contribution that Leonardo discovered and that is the Fibonacci series. The numbers are: 1, 1, 2, 3, 5, 8, 13, 21, 34, 55, 89, 144, … In Fibonacci in Nature we discussed this in more detail and said, “The ratios and relationships derived from this mathematical sequence are applied to the markets to help determine targets and retracement levels.”
In 1202, Fibonacci created a theoretical problem involving rabbits using the following parameters:
1. He begin with one pair of rabbits. 1 female rabbit and 1 male rabbit. These rabbits have just been born.
2. A rabbit will reach sexual maturity after one month.
3. The gestation period of a rabbit is one month.
4. Once it has reached sexual maturity, a female rabbit will give birth every month.
5. A female rabbit will always give birth to one male rabbit and one female rabbit.
6. Rabbits never die
The question he posed is how many rabbits will there be each month? At the beginning there is 1 pair, at the end of the first month two rabbits have mated but have not given birth. Therefore, there is still only one pair of rabbits. After two months, the first pair of rabbits gives birth to another pair, making two pair in all. After three months, the original pair gives birth again, and the second pair mate, but do not give birth. This makes three pair. After five months, every pair that was alive two months ago gives birth. This makes three new pair, for a total of eight.
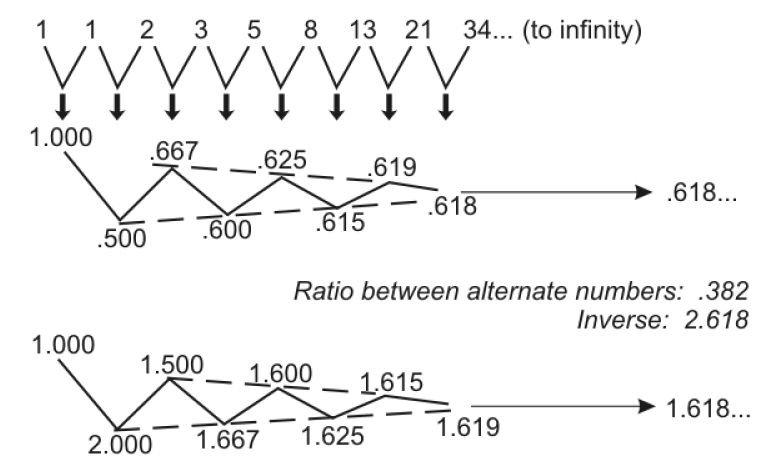 Figuring this out based on rabbits seems fairly complex but there is actually a simple formula. To create the Fibonacci sequence the first two numbers are added together to create the third number then the 2nd and 3rd are added to get the 4th and each subsequent number is the sum of the previous two.
But stock market investing takes it to another level i.e. Fibonacci ratios. To get Fibonacci ratios the 1st is divided by the second and the 2nd by the 3rd etc.
but today we are going to look at …
How to Identify Turning Points in Your Charts Using Fibonacci
By Elliott Wave International
In this trading lesson, Elliott Wave International’s Jeffrey Kennedy shows you how you can use Fibonacci to forecast potential turning points in your charts. You’ll learn the most common Fibonacci retracements and where to expect them in your charts. At the end of the lesson, you can get a Free 14-page Fibonacci eBook!
The primary Fibonacci ratios that I use in identifying wave retracements are .236, .382, .500, .618 and .786. Some of you might say that .500 and .786 are not Fibonacci ratios; well, it’s all in the math. If you divide the second month of Leonardo’s rabbit example by the third month, the answer is .500, 1 divided by 2; .786 is simply the square root of .618.
There are many different Fibonacci ratios used to determine retracement levels. The most common are .382 and .618.
The accompanying charts also demonstrate the relevance of .236, .382, .500 .618 and .786. It’s worth noting that Fibonacci retracements can be used on any time frame to identify potential reversal points. An important aspect to remember is that a Fibonacci retracement of a previous wave on a weekly chart is more significant than what you would find on a 60-minute chart.
With five chances, there are not many things I couldn’t accomplish. Likewise, with five retracement levels, there won’t be many pullbacks that I’ll miss. So how do you use Fibonacci retracements in the real world, when you’re trading? Do you buy or sell a .382 retracement or wait for a test of the .618 level, only to realize that prices reversed at the .500 level?

The Elliott Wave Principle provides us with a framework that allows us to focus on certain levels at certain times. For example, the most common retracements for waves two, B and X are .500 or .618 of the previous wave. Wave four typically ends at or near a .382 retracement of the prior third wave that it is correcting.

In addition to the above guidelines, I have come up with a few of my own over the past 10 years.
The first is that the best third waves originate from deep second waves. In the wave two position, I like to see a test of the .618 retracement of wave one or even .786. Chances are that a shallower wave two is actually a B or an X wave. In the fourth-wave position, I find the most common Fibonacci retracements to be .382 or .500. On occasion, you will see wave four retrace .618 of wave three. However, when this occurs, it is often sharp and quickly reversed.
My rule of thumb for fourth waves is that whatever is done in price, won’t be done in time. What I mean by this is that if wave four is time-consuming, the relevant Fibonacci retracement is usually shallow, .236 or .382. For example, in a contracting triangle where prices seem to chop around forever, wave e of the pattern will end at or near a .236 or .382 retracement of wave three. When wave four is proportional in time to the first three waves, I find the .500 retracement significant. A fourth wave that consumes less time than wave two will often test the .618 retracement of wave three and suggests that more players are entering the market, as evidenced by the price volatility. And finally, in a fast market, like a “third of a third wave,” you’ll find that retracements are shallow, .236 or .382.
In closing, there are two things I would like to mention. First, in each of the accompanying examples, you’ll notice that retracement levels repeat. Within the decline from the high in July Sugar (first chart), each countertrend move was a .618 retracement of the previous wave. The second chart demonstrates the same tendency with the .786 retracement. This event is common and is caused by the fractal nature of the markets.
Second, Fibonacci retracements identify high probability targets for the termination of a wave; they do not represent an absolute must-hold level. So when using Fibonacci retracements, don’t be surprised to see prices reverse a few ticks above or below a Fibonacci target. This occurs because other traders are viewing the same levels and trade accordingly. Fibonacci retracements help to focus your attention on a specific price level at a specific time; how prices react at that point determines the significance of the level.
 |
Learn How You Can Use Fibonacci to Improve Your TradingIf you’d like to learn more about Fibonacci and how to apply it to your trading strategy, download the 14-page free eBook, How You Can Use Fibonacci to Improve Your Trading.
EWI Senior Tutorial Instructor Wayne Gorman explains:
See how easy it is to use Fibonacci in your trading. Download your free eBook today >> |
See Also:
Fibonacci Clusters Show Important Resistance Level in Gold
The Gartley Fibonacci Butterfly Price Pattern and the Butterfly Put
Learn How to Apply Fibonacci Retracements to Your Trading
This article was syndicated by Elliott Wave International and was originally published under the headline How to Identify Turning Points in Your Charts Using Fibonacci. EWI is the world’s largest market forecasting firm. Its staff of full-time analysts led by Chartered Market Technician Robert Prechter provides 24-hour-a-day market analysis to institutional and private investors around the world.
Speak Your Mind