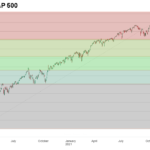
After a fairly rapid correction in January 2022, the market has started to rebound. So does that mean it’s safe to jump back into the market? After all, we saw a worse crash in January 2020 followed by a rapid rebound to new highs. And even the 2018 correction was short-lived. So have market participants become accustomed to quick rebounds? Or is this just a brief counter-trend rally?
Gold: See What This Fibonacci Ratio Says About the Trend
August 19, 2020 by Leave a Comment
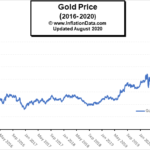
Gold has been a star performer in the markets recently with gold making a new all-time high of $2067.15 on August 6th. From there it retreated to $1931 on August 12th before resuming its climb. On August 18th it closed just above $2000 and then retreated to $1927.90 on August 19th . So we have seen quite a bit of volatility this month in gold. It certainly would be nice to know beforehand where it would stop and turn.
Junk Bonds: 2 “Golden” Junctures
March 28, 2020 by Leave a Comment
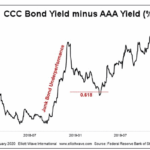
The Golden Ratio — 1.618 or .618 — is ubiquitous throughout nature. You’ll find this mathematical proportion in the shapes of galaxies, sea horses, pine cones, the arrangement of seeds on a sunflower head, and numerous other natural phenomena… including the chart patterns of financial markets.
Fibonacci Clusters Show Important Resistance Level in Gold
May 4, 2013 by 1 Comment
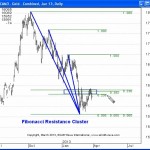
Senior Analyst Jeffrey Kennedy shares techniques that helped spot a trading opportunity. By Elliott Wave International If you use Elliott in your technical analysis, you may already use Fibonacci ratios to determine targets and retracement levels in your charts. But have you heard of “Fibonacci Clusters?” Elliott Wave Junctures editor Jeffrey Kennedy shares his charts […]
Learn How to Apply Fibonacci Retracements to Your Trading
February 9, 2012 by Leave a Comment
EWI’s new eBook helps you identify trading opportunities Elliott waves often correct in terms of Fibonacci ratios. The following article, adapted from the eBook How You Can Use Fibonacci to Improve Your Trading, explains what you can expect when a market begins a corrective phase. Learn how you can read the entire 14-page eBook below.
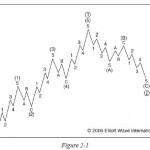
Applying Fibonacci to Stock Market Patterns: It’s easier than you might think!
February 3, 2012 by Leave a Comment
Patterns are everywhere. We see them in the ebb and flow of the tide, the petals of a flower, or the shape of a seashell. If we look closely, we can see patterns in almost everything around us. The price movements of financial markets are also patterned, and Elliott wave analysis gives you the tools […]
Understanding Fibonacci
October 6, 2011 by Leave a Comment
Learn to apply Fibonacci ratios to calculate price targets in stocks The Fibonacci ratio can be an invaluable tool for calculating price retracements and projections in your analysis and trading. This excerpt from The Best Technical Indicators for Successful Trading explains the origins of the Fibonacci sequence and how you can apply it to the […]
Trading the GDX Fibonacci Butterfly
July 13, 2011 by Leave a Comment
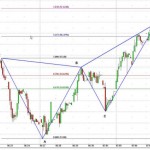
There is a great deal of interest in trading Gold these days. And many different ways to do it. One method is using the Market Vectors Gold Miners ETF, symbol $GDX. Of course once you decide on the medium you still need a method of determining entry and exit points. In today’s article JW Jones […]
What Does a Fractal Look Like?
May 27, 2011 by Leave a Comment

And What Does It Have to Do with the Stock Market? Fractals are common in nature but you don’t expect them in the stock market. But as you’ll see in this article fractals are found almost everywhere and by understanding them you can better predict the future direction of the stock market. May 26, […]
Elliottwave For- Where Technical Studies Fall Short
May 12, 2011 by Leave a Comment
5 Ways the Wave Principle Can Improve Your Trading May 12, 2011 By Elliott Wave International Every trader, every analyst and every technician has favorite techniques to use when trading. But where traditional technical studies fall short, the Wave Principle kicks in to show high-probability price targets. Just as important, it can distinguish high-probability trade […]