The word “fractal” often means different things to the lay public compared to mathematicians. The public tends to think of fractal art while mathematicians think of the formula that generates the art. The mathematical concept is difficult to define formally, even for mathematicians, but the key feature of a fractal is that if you “zoom in” nothing changes, the same pattern just repeats over and over. The interesting thing is that fractals appear quite frequently in nature. From things as small as DNA, to Snowflakes and Crystals, to Pineapples, Ocean waves and Mountain Ranges, fractals are everywhere. Interestingly, they are also present in the stock market as we look at Minute Charts, compared to Hourly, Daily, Weekly, Monthly, etc.
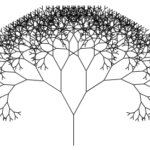
What Does a Fractal Look Like?
May 27, 2011 by Leave a Comment

And What Does It Have to Do with the Stock Market? Fractals are common in nature but you don’t expect them in the stock market. But as you’ll see in this article fractals are found almost everywhere and by understanding them you can better predict the future direction of the stock market. May 26, […]