the market follows the Wave Principle. It is not governed by the anticipation of future events, or for that matter, current events or anything external to the market.
Forecasting Markets by Looking at Chart Patterns
July 28, 2020 by Leave a Comment

The word “fractal” often means different things to the lay public compared to mathematicians. The public tends to think of fractal art while mathematicians think of the formula that generates the art. The mathematical concept is difficult to define formally, even for mathematicians, but the key feature of a fractal is that if you “zoom in” nothing changes, the same pattern just repeats over and over. The interesting thing is that fractals appear quite frequently in nature. From things as small as DNA, to Snowflakes and Crystals, to Pineapples, Ocean waves and Mountain Ranges, fractals are everywhere. Interestingly, they are also present in the stock market as we look at Minute Charts, compared to Hourly, Daily, Weekly, Monthly, etc.
Repeating Patterns = Profit Potential
January 31, 2020 by Leave a Comment
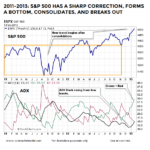
As shown in the charts, the S&P 500 performed quite well walking forward from February 1, 2013 and December 9. 2016, both periods are similar to December 23, 2019, which tells us to remain open to better than expected outcomes in 2020.
Applying Fibonacci to Stock Market Patterns: It’s easier than you might think!
February 3, 2012 by Leave a Comment
Patterns are everywhere. We see them in the ebb and flow of the tide, the petals of a flower, or the shape of a seashell. If we look closely, we can see patterns in almost everything around us. The price movements of financial markets are also patterned, and Elliott wave analysis gives you the tools […]
The Stock Market Is Patterned — Here’s Proof
March 24, 2010 by Leave a Comment
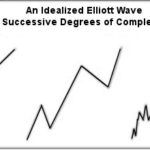
Understanding how the market progresses at all degrees of trend gives you an invaluable perspective. No longer do you have to sift through the latest economic data as if they were tea leaves. You gain a condensed view of the whole panorama of essential trends in human social mood and activity, as far back as the data can take you.
Same Day. Same Event. Same Market. Different Story!
February 23, 2010 by Leave a Comment
Elliott wave analysts sometimes hear the criticism that patterns in market charts can be “open to interpretation.” Does that happen? Absolutely. (Although, there are tools an Elliottician can always employ to firm up the wave count.) But here’s the real question: What’s the alternative? Here’s Bob Prechter’s take on it.