
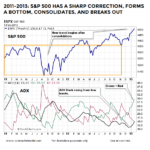
In his latest weekly market video, Chris Ciovacco of Ciovacco Capital walks through a broad set of technical charts and indicators to answer one key question: do current market conditions align with a bottoming process in stocks? After the S&P 500 gained over 3% in the past five trading sessions, the evidence continues to lean toward “so far, so good” — with breadth indicators, credit markets, and key moving averages all holding at critical support levels. While short-term hurdles remain, the weight of evidence looks far more like the corrections of 2023 and early 2025 than the bear market of 2022. Watch the full video breakdown below.
Stocks and Junk Bonds: “This Divergence Appears Meaningful”
June 28, 2023 by Leave a Comment
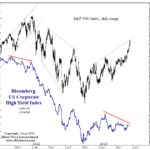
The trends of the junk bond and stock markets tend to be correlated.
The reason why is that junk bonds and stocks are closely affiliated in the pecking order of creditors in case of default. The rank of junk bonds is only slightly higher than equities because debt involves a contract.
Given these two markets are usually correlated, it’s worth paying attention when a divergence takes place. Indeed, a divergence is in the works now. In other words, while stocks have been holding up, the price of junk bonds have been trending lower for much of the year.
What to Make of the Stock Market’s Bounce
June 7, 2022 by Leave a Comment
“For certain, there will be countertrend rallies” By Elliott Wave International The stock market selloff from March into the May low was comprised of eight straight weeks of decline in the Dow Industrials. This was historic. The Dow Industrials have been around for 126 years and this was only the second time that the senior […]
Is the Correction Over?
January 27, 2022 by Leave a Comment
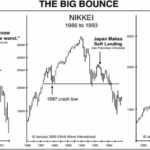
After a fairly rapid correction in January 2022, the market has started to rebound. So does that mean it’s safe to jump back into the market? After all, we saw a worse crash in January 2020 followed by a rapid rebound to new highs. And even the 2018 correction was short-lived. So have market participants become accustomed to quick rebounds? Or is this just a brief counter-trend rally?
Repeating Patterns = Profit Potential
January 31, 2020 by Leave a Comment
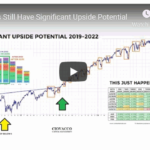
As shown in the charts, the S&P 500 performed quite well walking forward from February 1, 2013 and December 9. 2016, both periods are similar to December 23, 2019, which tells us to remain open to better than expected outcomes in 2020.
The Beginning of a Long-Term “Secular” Bull Market?
December 4, 2019 by Leave a Comment
In the following article, Chris Ciovacco of Ciovacco Capital Management takes a look at the mood of the common investor as the outflows of equity funds reach new levels of pessimism. These levels are actually more pessimistic than in July 2016 when everyone was convinced that Hillary was going to be elected. They are even more pessimistic than at the depths of despair in March 2009 after the beginning of the “Great Recession”. So what is going on? ~ Tim McMahon, editor.
This Doesn’t Happen in Bear Markets
September 4, 2018 by Leave a Comment
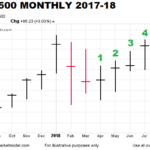
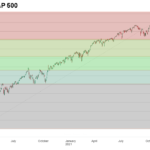
When the stock market peaked in late January, many hypothesized it was the beginning of a long-term bear market. As shown in the S&P 500 monthly chart below, stocks posted red months in February and March, and went on to post gains for five consecutive months. The green months in April, May, June, July, and August mean the S&P 500 posted gains in 11 of the last 13 months.
The Stock Market Big Picture
June 20, 2018 by Leave a Comment

One of the keys to making more prudent and rational decisions is to look at more than just the red screen in front of us, which represents only one timeframe (the shortest). It can also be helpful to think in extremes.
Using Longer Timeframes To Combat Volatility Fatigue
June 14, 2018 by Leave a Comment
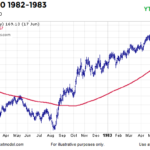
A December 2016 video covered an extremely rare signal that occurred in 1982 and 2016. Since then, markets have reacted in a bullish manner, meaning we have no reason to doubt the long-term signal that occurred at the end of 2016. Therefore, it may be helpful to understand the stock market’s volatility profile between 1983 and 1985.
Taking the Long View of the Market
July 26, 2017 by Leave a Comment
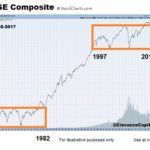
In the following article Chris Ciovacco of Ciovacco Capital Management takes a look at the big picture of the stock market. It is very possible the stock market’s behavior between 2016 and 2034 will be significantly different from its behavior between 1997 and 2015. Therefore, our approach to the markets needs to be flexible enough to handle the possibility of much stronger and sustained trends than what we have seen in our investment lifetimes.