
In his latest weekly market video, Chris Ciovacco of Ciovacco Capital walks through a broad set of technical charts and indicators to answer one key question: do current market conditions align with a bottoming process in stocks? After the S&P 500 gained over 3% in the past five trading sessions, the evidence continues to lean toward “so far, so good” — with breadth indicators, credit markets, and key moving averages all holding at critical support levels. While short-term hurdles remain, the weight of evidence looks far more like the corrections of 2023 and early 2025 than the bear market of 2022. Watch the full video breakdown below.
Hooking Potential Trade Set-ups
July 13, 2011 by Leave a Comment
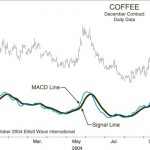
How to Combine Technical Indicators with Elliott Wave Analysis By Elliott Wave International Trading using technical indicators — such as the MACD, for example, Moving Average Convergence-Divergence — can do one of two things: help you or hinder you. Using them as a forecasting method alone can be about as predictable as flipping a coin. […]