
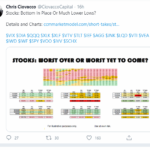
In his latest weekly market video, Chris Ciovacco of Ciovacco Capital walks through a broad set of technical charts and indicators to answer one key question: do current market conditions align with a bottoming process in stocks? After the S&P 500 gained over 3% in the past five trading sessions, the evidence continues to lean toward “so far, so good” — with breadth indicators, credit markets, and key moving averages all holding at critical support levels. While short-term hurdles remain, the weight of evidence looks far more like the corrections of 2023 and early 2025 than the bear market of 2022. Watch the full video breakdown below.
Stocks: Is the Worst Over or is there Worse Yet to Come?
March 28, 2020 by Leave a Comment
Chris Ciovacco of Ciovacco Capital Management always presents a well-reasoned approach to the market in his “short-takes” video. He emphasizes that we need to look at the preponderance of the evidence but even that doesn’t “guarantee” any future market action. All that we can do is see what has happened in the past and determine the probability that it will happen that way again. Even if 90% of the time some indicator resulted in a rise (or fall) in the market one time out of ten the opposite could still happen so we need to be prepared and listen to what the market is telling us. In Yesterday’s video Chris Ciovacco looked at volatility (i.e. the VIX) and what it is telling us regarding the current state of the market. Interestingly, recent VIX activity was actually worse than in any other crash tracked since 1990 putting it on par with the 2008 crash and in terms of volatility it was actually worse than 2008.
The Long-Term Message from the VIX
April 17, 2019 by Leave a Comment
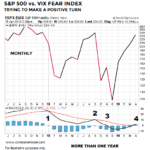
The VIX measures the market’s expectation of future volatility. We can think of the S&P 500/VIX ratio as a way to track confidence in stocks and earnings relative to confidence the market will be volatile. The S&P 500/VIX ratio is currently in the process of trying to complete a relatively rare longer-term shift.
Trading Volatility
January 9, 2013 by
Volatility is the amount that a stock moves over a given period of time. At times markets experience periods of low volatility when the difference between the highs and the lows are relatively small. At other times, the market may experience high volatility with wild swings from low to high and back again. Generally, high […]
What Do These 8 Technical Indicators Mean for the Markets?
May 7, 2010 by Leave a Comment
Robert Prechter reveals how 8 technical indicators are aligning to form a forecast for the market that’s too urgent to ignore.