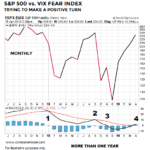
The VIX measures the market’s expectation of future volatility. We can think of the S&P 500/VIX ratio as a way to track confidence in stocks and earnings relative to confidence the market will be volatile. The S&P 500/VIX ratio is currently in the process of trying to complete a relatively rare longer-term shift.
Watch This Indicator for Approaching Volatility
December 19, 2018 by Leave a Comment
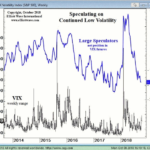
The stock market’s volatility from late July through early October was extraordinarily low. For 50 straight days the S&P 500 had not closed more than 0.8% in either direction, the longest such streak since 1968.
Yet, on October 3, all that changed. The markets dropped hard… and the VIX suddenly spiked even harder.
Trading Volatility
January 9, 2013 by
Volatility is the amount that a stock moves over a given period of time. At times markets experience periods of low volatility when the difference between the highs and the lows are relatively small. At other times, the market may experience high volatility with wild swings from low to high and back again. Generally, high […]