The Volatility Index, known by its ticker symbol VIX, was created and maintained by the Chicago Board Options Exchange (CBOE). It is used as a measure of the stock market’s expectation of volatility based on S&P 500 index options and is commonly considered the fear index or the fear gauge. The VIX is quoted in percentage points and represents the expected range of movement in the S&P 500 index over the next year. So, if the VIX is 15, this represents an expected annualized change, with a 68% probability, of less than 15% up or down. Although the VIX is often called the “fear index”, a high VIX is not necessarily bearish for stocks. Rather, high VIX readings mean investors see significant risk that the market will move sharply, whether downward or upward. ~Tim McMahon, editor
Stocks vs. Expected Volatility
By Chris Ciovacco of Ciovacco Capital Management
The VIX measures the market’s expectation of future volatility. We can think of the S&P 500/VIX ratio as a way to track confidence in stocks and earnings relative to confidence the market will be volatile. The S&P 500/VIX ratio is currently in the process of trying to complete a relatively rare longer-term shift.
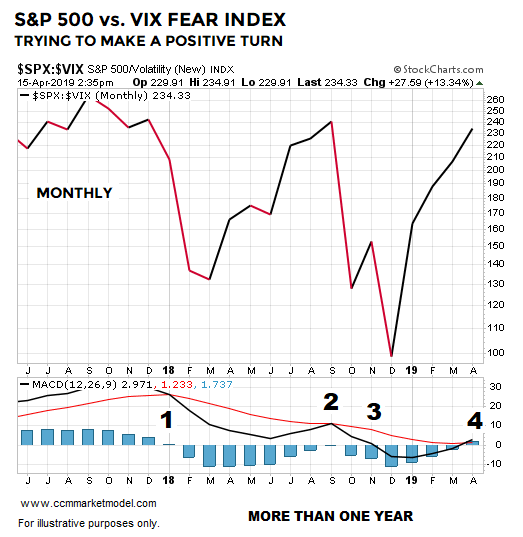
Number One: Bearish MACD cross above the centerline tells us the intermediate-term trend shifted to favoring volatility over stocks.
Number Two: The intermediate-trend trend failed to flip back in favor of stocks (MACD black stayed below MACD red).
Number Three: MACD black dropped below the centerline which indicated the longer-term trend was starting to favor volatility over stocks.
Number Four: In April 2019, MACD is trying to complete two steps: (1) MACD black above MACD red tells us the intermediate-term trend is trying to flip back in favor of stocks, and (2) MACD black above the centerline tells us the long-term trend is trying to turn back in favor of stocks.
Important: It took over 365 calendar days to complete all four steps, telling us this was a long-term shift in sentiment and economic confidence that produced heavy selling pressure before seeing a reversal in 2019.
What Does History Tell Us?
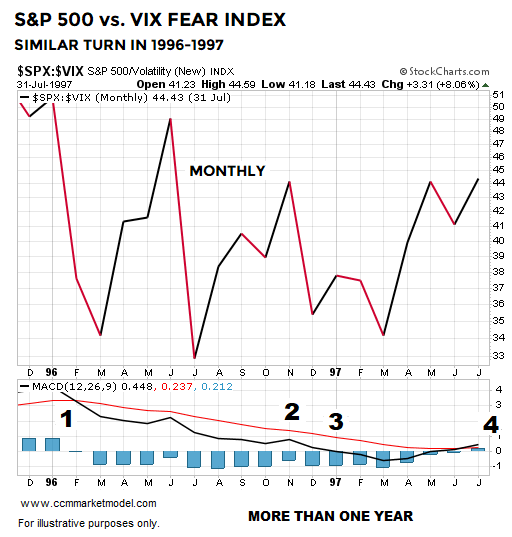
The VIX is a relatively new instrument; thus, our study period only dates back to 1993. How many times has the S&P 500/VIX ratio been able to check all four boxes over a 365-day period or longer? The answer is four times. The 1996-1997 case is shown below.
What Happened Next?
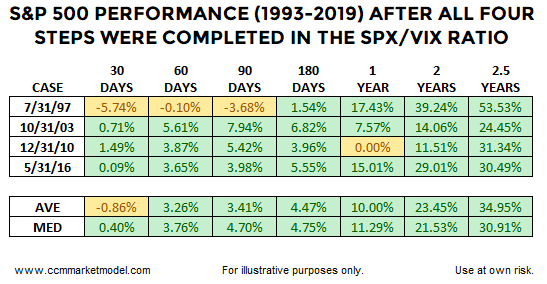
The table below shows S&P 500 performance after all the boxes had been checked in each historical case. Returns had a positive bias over the first 90 days, but the 1997 case reminds us givebacks, corrections, and retracements are a normal part of all trends. Given our longer-term approach, the more relevant outcome in the historical cases was the market’s longer-term performance. All four historical cases posted positive returns 2.5 years down the road with the average and median gain exceeding 30%.
 The Mother of All Breadth-based Signals?
This week’s stock market video looks at a rare move that took place between 12/24/2018 and 04/08/2019 and asks how many times has this taken place in the past and what happened next in the stock market?
Weight of the Evidence
There is nothing magical about the S&P 500/VIX ratio. However, it is another example of something that just happened in the present day that was followed by favorable long-term results in the stock market, telling us to keep an open mind about the possibility of better than expected outcomes in the coming months and years.
Given it is only April 15, the look of the 2019 S&P 500/VIX chart must carry into month-end; something that falls into the TBD category.
This article by Chris Ciovacco originally appeared here and has been reprinted by permission.
You might also enjoy:
- The Psychology of Volatility
- Traders Should Stay Optimistically Cautious
- NASDAQ Signal Has Only Occurred 15 Times In Last 42 Years
- Reversals And Counter-trend Moves Typically Take Time To Develop
Speak Your Mind