So far, the research team, at The Technical Trades Ltd., has been calling this market move quite accurately. On September 17, 2018, they called for a -5~8% downside market rotation, followed by price support just before the November 2018 US elections. After that, they called for a deep “Ultimate Low” price rotation followed by a strong price rally. Even though they under-estimated the depth of the correction their trend predictions from 120 days earlier played out quite accurately. So here is what they are currently saying. ~Tim McMahon, editor
Optimistically Cautious Going Forward
The one interesting facet of the various research posts our team continues to digest is the continued bearish sentiment that exudes from some analysts. It appears these technical gurus have become married to the concept that global economic issues will crash the US stock market in the near future. We have to give them some credit though. We wanted to take a few minutes of your time to try to highlight how and why we believe these technical gurus are making these points so clearly now and why we believe there are multiple catalysts that they are simply failing to comprehend.
Our team of researchers continues to learn from other skilled researchers, clients, and technicians. Every time we read some news item or someone’s research post, we don’t take the research with a pretense that “these researchers are wrong in their conclusions”. We start off with the pretense that “maybe these people are highlighting something we missed – let’s investigate it”. Thus, our quest is never-ending in the search for greater knowledge and practical application of price theory and technical analysis.
Our recent article highlighting the Expanding Wedge price pattern that is currently setting up in the US stock markets shows what we believe will be the likely outcome for the near-term future – the formation of a Pennant/Flag formation followed by an upside breakout move higher. Although we believe this is the most likely outcome, traders still need to be optimistically cautious going forward.
Tools like MACD and RSI are great for making points on charts. These technical indicators can show historically valid triggers and generate a sense of panic if presented in a certain context. Here is an example.
RSI Peaking! History has shown that when RSI peaks above 80, the markets typically correct by at least 8%. Look out below! Look at the right side of this chart, RSI is currently at the highest level since November 2014 and we can see the markets rotated downward by at least 5% shortly after this peak.
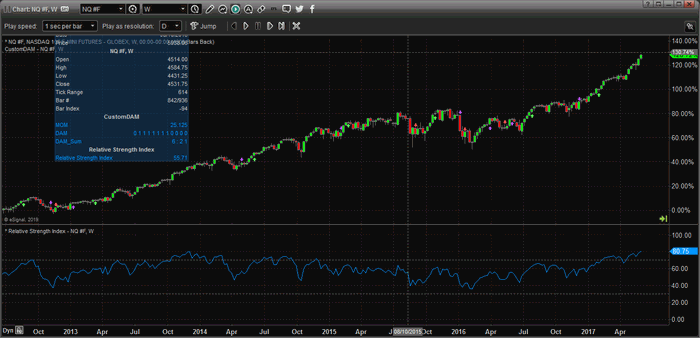
Yet, what really happened after this peak is shown in the chart below.
See the Full Article Here
You might also like:
- Has the FED Hit the Launch Button for the Stock Market?
- How to Build Consistent Trading Success
- Reversals And Counter-trend Moves Typically Take Time To Develop
- Watch This Indicator for Approaching Volatility
Speak Your Mind