Last week Chris Ciovacco of Ciovacco Capital Management posted a video with his always thorough analysis considering whether this was the last hurrah before a major bear market or the final
test of support before the market resumed its uptrend. He entitled it “Trend Exhaustion or Eminent Plunge” . At around the 5:35 point, that video explains the Demark Studies “9-13” setup for
a reversal and how it plays into this week’s analysis. “9-13” signals on the downside are relatively rare but we got one in May. So, we need to keep an open mind to the possibility of a reversal to
the upside. Even though from a sentiment perspective or even a fundamental perspective it is very difficult to see how any good can be in the pipeline.
Is the Correction Over Yet?
May 31, 2022 by Leave a Comment
Traders Should Stay Optimistically Cautious
February 20, 2019 by Leave a Comment
So far, the research team, at The Technical Trades Ltd., has been calling this market move quite accurately. On September 17, 2018, they called for a -5~8% downside market rotation, followed by price support just before the November 2018 US elections. After that, they called for a deep “Ultimate Low” price rotation followed by a strong price rally. Even though they under-estimated the depth of the correction their trend predictions from 120 days earlier played out quite accurately. So here is what they are currently saying.
Stocks Can’t Keep Going Up Forever… Or Can They?
January 22, 2018 by Leave a Comment
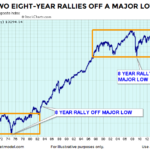
Wall Street traders love to live by “truisms”, “clichés”, and/or “maxims”. One such refrain that we constantly hear is that “Stocks can’t keep going up forever” but then there is “the trend is your friend” and “the market climbs a wall of worry”. When you put them all together what do you get? Should you worry about a top or should you be happy that others are still worried… because that means the top isn’t here yet? After-all, the market continues to climb until everyone has bought. If there are still bears out there, they are still potential buyers. On our NYSE Rate of Change page we published a couple of charts by “Chart of the Day” which showed the average length of rallies before a 15% and 20% decline. But if you take a longer term view, even a 15-20% correction could be inside a longer term bull market.
In today’s post, Chris Ciovacco of Ciovacco Capital Management takes a look at the historical precedent for the current market.
Trump Bump Slaughters Market Bears
March 8, 2017 by Leave a Comment
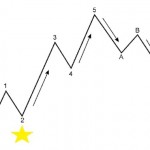
Much of the post-US election rally in the stock market has been attributed to President Donald Trump’s promises for tax cuts and deregulation. But long before the election, Elliott wave price patterns already told our subscribers to prepare for a market rally.
Stocks And Bonds- Testing Key Areas
July 11, 2016 by Leave a Comment
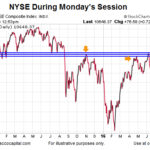
While the S&P 500 (SPY) was able to push to a new high during Monday’s trading session, the broad NYSE Composite Stock Index (VTI) was still looking for a close above an area that acted as resistance in the past.
The U.S. Dollar’s 2014-2015 Rally
July 4, 2015 by Leave a Comment
Let’s look at the 2014-15 Dollar rally and how the Elliott Wave Principle applies to Currencies and Foreign Exchange (Forex). I always say trading forex markets is like riding a bike — except that said bike has one flat tire and the ground beneath it is covered in ice.
So why is Forex so popular, you might ask? In fact, forex is the most liquid market on earth, where trillions of dollars change millions of hands every day.
The reason people are so willing to ride that bike — so to speak — is because if you can stay on, the rewards are often unmatched. The trick, of course, is staying on.