Wall Street traders love to live by “truisms”, “clichés”, and/or “maxims”. One such refrain that we constantly hear is that “Stocks can’t keep going up forever” but then there is “the trend is your friend” and “the market climbs a wall of worry”. When you put them all together what do you get? Should you worry about a top or should you be happy that others are still worried… because that means the top isn’t here yet? After-all, the market continues to climb until everyone has bought. If there are still bears out there, they are still potential buyers. On our NYSE Rate of Change page we published a couple of charts by “Chart of the Day” which showed the average length of rallies before a 15% and 20% decline. But if you take a longer term view, even a 15-20% correction could be inside a longer term bull market. In today’s post, Chris Ciovacco of Ciovacco Capital Management takes a look at the historical precedent for the current market. ~Tim McMahon, editor.
History Says Stocks Can Keep Going Up
HISTORICAL PRECEDENT
A common bearish argument making the rounds over the past year goes something like this:
“Stocks have been rising for over eight years; they can’t keep going up.”
As shown in the NYSE Composite chart below, stocks rallied for eight years off a major low in 1974, broke out to a new all-time high, and then subsequently rallied for an additional 18 years. In present day, stocks rallied off the 2009 major low and broke out in 2017 making a new all-time high. 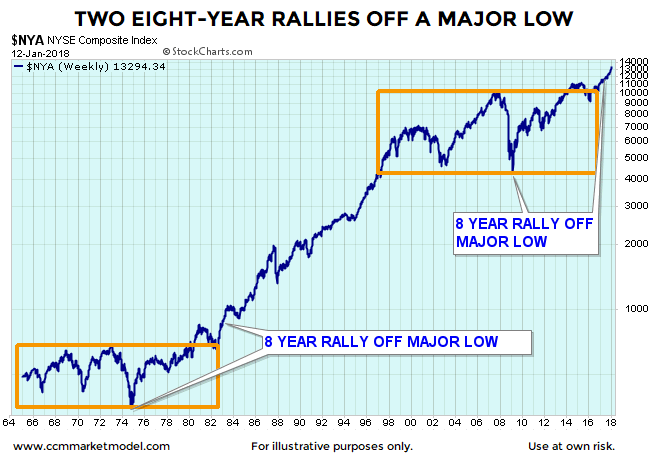
WHAT HAPPENED NEXT?
Given humans tend to extrapolate the recent past into the future, many expect the next major move for the markets in 2018 is a 50%-plus bear market similar to the 2000-2002 and 2007-2009 periods. That is not what happened after the similar historical setup in the early 1980s. Instead of following the 1964-1980 script, stocks tacked on an additional gain of over 700% (see chart below). 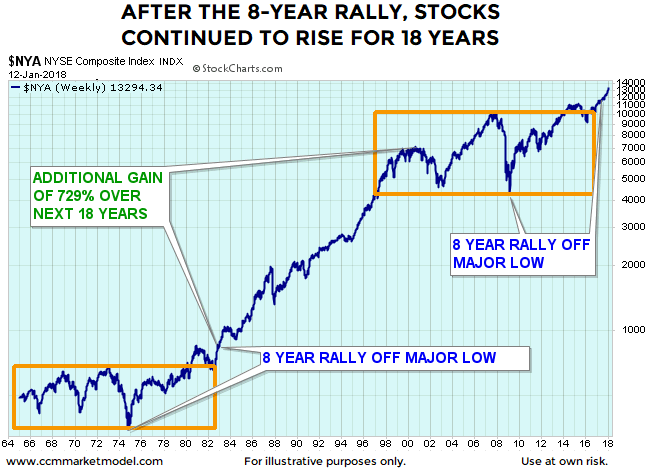
BUT, WHAT ABOUT VALUATIONS?
If we are to take the “all the charts are meaningless because of valuations” argument seriously, we must convince ourselves that valuations were a useful timing tool between 1964 and the stock market peak in 2000.
A FAIR AND FACT-BASED ASSESSMENT
In order to make a prudent assessment of the real-world utility of valuations, we must review the information that was available as stocks marched higher between the end of 1982 and 2000. For example, when stocks broke out to a new all-time high in 1982, the median Shiller PE or CAPE ratio looking backwards (1881-1982) was 14.83. 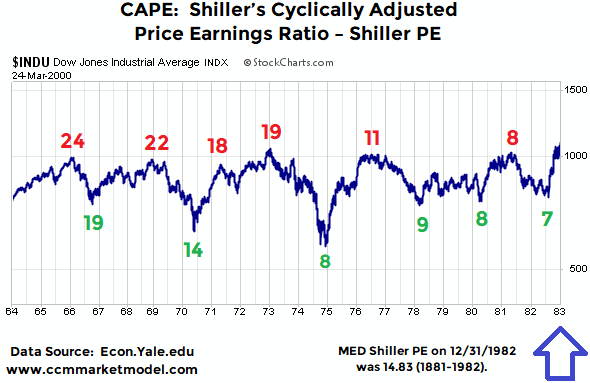 This week’s video takes a detailed look at two periods, 1992-2000 and 1956-2000, to evaluate the effectiveness of attempting to use the Shiller PE or CAPE ratio as a market timing tool. In the video, Shiller PEs are reviewed on stock charts, allowing you to draw your own fact-based conclusions.
To view the video in full screen mode, click the square icon in the lower right corner of the video player. To exit full screen mode, hit the Esc key (escape).
Originally posted here on January 16,2018 and reprinted by permission.
You might also like:
Speak Your Mind