In the following article by Chris Ciovacco of Ciovacco Capital Management takes a look at the big picture of the stock market. ~Tim McMahon, editor
Stocks: The Forrest and the Trees
The expression “the market needs to consolidate its gains” applies to all timeframes, from 60 minutes to 60 years. The chart below shows the NYSE Composite consolidating between 1965 and 1982. After the consolidation period ended, stocks surprised on the upside between 1982 and 2000.
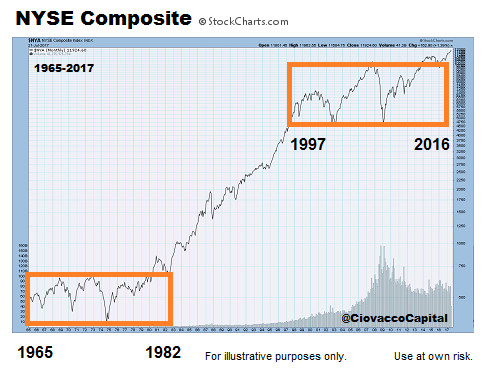
A similar “the market needs to consolidate its gains” period occurred between 1997 and 2016. The recent break above the orange consolidation box tells us to be open to much better than expected outcomes in the stock market over the next 5 to 15 years. The longer the 2016 bullish breakout holds, the more relevant it becomes.
“To change ourselves effectively, we first have to change our perceptions.”
Stephen Covey
Volatility To Ignore Or Volatility To Respect
This week’s video takes a detailed look at a major market top to help us better discern between stock market volatility to ignore and stock market volatility to respect. The video also looks at the pros and cons of building a portfolio based on asset class correlations.


Nowhere Man
The NYSE Composite was trading at the exact same level in May 1997, February 2003, and February 2009 (stocks made no progress for 11.74 years). The NYSE Composite was trading at the same level in October 2007 and July 2016 (stocks made no progress for 8.75 years).
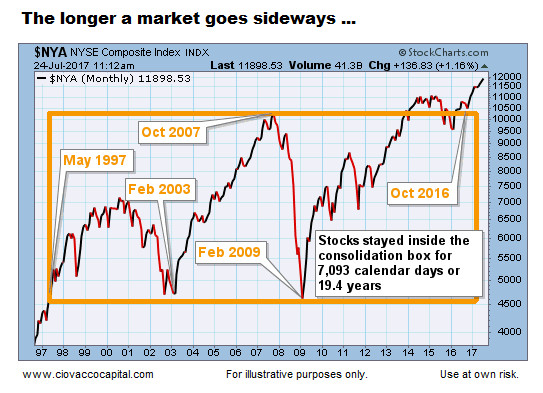
As illustrated via the big move after the breakout in 1982, the longer a market goes sideways, the bigger the move we can expect to get after a breakout or breakdown.
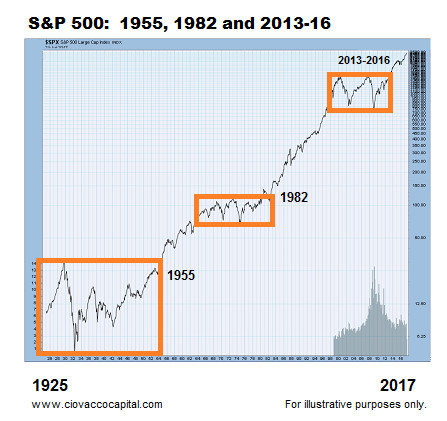
2013-16, Like 1980-82, Was A Unique Period
Just as 1982 was significantly different from 1955, 2016 was significantly different from 1982. Each period in history has its own unique mix of economic and technical data. Stocks rallied for years after breaking out in both 1955 and 1982; a similar breakout occurred in the NYSE Composite and NASDAQ in 2016. The S&P 500 started the current breakout cycle in 2013.
A Market Many Of Us Have Not Seen
It is very possible the stock market’s behavior between 2016 and 2034 will be significantly different from its behavior between 1997 and 2015. Therefore, our approach to the markets needs to be flexible enough to handle the possibility of much stronger and sustained trends than what we have seen in our investment lifetimes.
“Intelligence is the ability to adapt to change.”
Stephen Hawking
This article originally appeared here and has been reprinted by permission.
Speak Your Mind