In the following video, Chris Ciovacco of Ciovacco Capital Management looks at several market indicators and the recent rebound.
Is the Correction Over?
January 27, 2022 by Leave a Comment
After a fairly rapid correction in January 2022, the market has started to rebound. So does that mean it’s safe to jump back into the market? After all, we saw a worse crash in January 2020 followed by a rapid rebound to new highs. And even the 2018 correction was short-lived. So have market participants become accustomed to quick rebounds? Or is this just a brief counter-trend rally?
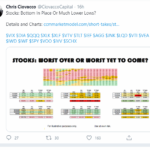
Stocks: Is the Worst Over or is there Worse Yet to Come?
March 28, 2020 by Leave a Comment
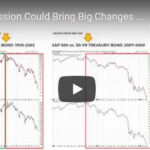
Chris Ciovacco of Ciovacco Capital Management always presents a well-reasoned approach to the market in his “short-takes” video. He emphasizes that we need to look at the preponderance of the evidence but even that doesn’t “guarantee” any future market action. All that we can do is see what has happened in the past and determine the probability that it will happen that way again. Even if 90% of the time some indicator resulted in a rise (or fall) in the market one time out of ten the opposite could still happen so we need to be prepared and listen to what the market is telling us. In Yesterday’s video Chris Ciovacco looked at volatility (i.e. the VIX) and what it is telling us regarding the current state of the market. Interestingly, recent VIX activity was actually worse than in any other crash tracked since 1990 putting it on par with the 2008 crash and in terms of volatility it was actually worse than 2008.
Taking the Long View of the Market
July 26, 2017 by Leave a Comment
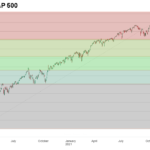
In the following article Chris Ciovacco of Ciovacco Capital Management takes a look at the big picture of the stock market. It is very possible the stock market’s behavior between 2016 and 2034 will be significantly different from its behavior between 1997 and 2015. Therefore, our approach to the markets needs to be flexible enough to handle the possibility of much stronger and sustained trends than what we have seen in our investment lifetimes.
Stock Market Breadth: Is It Really That Bad?
December 8, 2015 by Leave a Comment
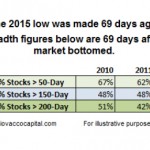
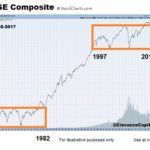
Market breadth speaks to the percentage of stocks participating in a stock market rally. All things being equal, the broader the participation the healthier the market. In this article, we will examine breadth for both the S&P 500 and NYSE Composite Stock Index. We will also examine 2015 breadth vs. similar points after a correction and similar points in a bear market. Stock market breadth is not particularly useful as a short-term timing tool for the S&P 500; it can be helpful on longer-term time horizons.
Market Trends Diverging
January 8, 2015 by 1 Comment
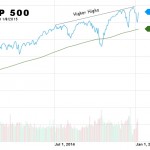
Today we are going to take a look at two common stock market charts that individually tell opposite stories but when combined give us an interesting insight into the overall market. The first chart is the S&P 500. As I’m sure you are aware the S&P 500 represents Standard and Poor’s top 500 companies.
The Plunge Protection Team Strikes Again
October 28, 2014 by Leave a Comment
We have been expecting a major correction for quite some time now. In preparation for a market correction the index starts growing more slowly and then finally starts falling. Our NYSE Rate of Change (ROC) chart showed a slowing growth level and then generated a sell signal back in the first quarter of 2014. But […]