The market soared 27% since the December low. And continued despite the media beating the gloom and doom drum of the “Debt Ceiling”.
1987 vs. 2018
October 26, 2018 by Leave a Comment
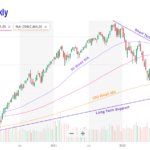
Typically, investors see October as a tough month for the Stock market with “The Panic of 1907 (October 1907)”, Black Tuesday, Thursday and Monday (October 1929), and Black Monday (October 1987). But according to Investopedia September is actually just as bad with Black Friday (September 1869), Black Wednesday i.e. September 16, 1992, when the pound sterling crashed forcing Britain to withdraw from the European Exchange Rate Mechanism (ERM). September 2001 and 2008 each had single day point declines in the Dow that were bigger than Black Monday October 1987. A 2014 Business insider article stated that “the Dow October average over this timeframe is a modest 0.20%. There have been 64 monthly gains and 49 monthly losses. That’s calculates as a gain about 57% of the time.” The following article by Chris Ciovacco of Ciovacco Capital Management compares market action in October 1987 to October 2018.
Stock Market Breadth: Is It Really That Bad?
December 8, 2015 by Leave a Comment
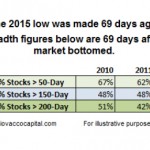
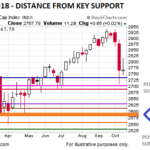
Market breadth speaks to the percentage of stocks participating in a stock market rally. All things being equal, the broader the participation the healthier the market. In this article, we will examine breadth for both the S&P 500 and NYSE Composite Stock Index. We will also examine 2015 breadth vs. similar points after a correction and similar points in a bear market. Stock market breadth is not particularly useful as a short-term timing tool for the S&P 500; it can be helpful on longer-term time horizons.