
At the end of last week, Chris Ciovacco recorded his weekly “Short-Takes” market analysis, and overall, things looked quite bullish. Most markets were above their moving averages, trends were turning up, and things were looking good. And then this week, markets turned down, and things got gloomier. But as we’ve said before, Stocks Don’t Go Straight Up (or Straight Down), and Chris said last week that he wouldn’t be surprised to see the markets like the S&P 500 retest the 3900-3950 levels. This is all part of a healthy consolidation. Of course, if markets fall below certain levels, we must reevaluate our position and see if the 2023 rally was just a “Bull Trap” after all. We should remember that the FED is still tightening, and we know “fighting the FED” is generally a bad idea.
The Market is Currently a “Mixed Bag”
In the following video, Chris Ciovacco of Ciovacco Capital Management looks at several market indicators and the recent rebound.
Is the Correction Over?
After a fairly rapid correction in January 2022, the market has started to rebound. So does that mean it’s safe to jump back into the market? After all, we saw a worse crash in January 2020 followed by a rapid rebound to new highs. And even the 2018 correction was short-lived. So have market participants become accustomed to quick rebounds? Or is this just a brief counter-trend rally?
Stocks: Is the Worst Over or is there Worse Yet to Come?
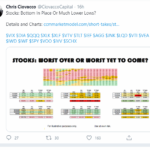
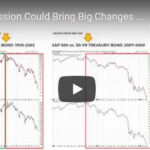
Chris Ciovacco of Ciovacco Capital Management always presents a well-reasoned approach to the market in his “short-takes” video. He emphasizes that we need to look at the preponderance of the evidence but even that doesn’t “guarantee” any future market action. All that we can do is see what has happened in the past and determine the probability that it will happen that way again. Even if 90% of the time some indicator resulted in a rise (or fall) in the market one time out of ten the opposite could still happen so we need to be prepared and listen to what the market is telling us. In Yesterday’s video Chris Ciovacco looked at volatility (i.e. the VIX) and what it is telling us regarding the current state of the market. Interestingly, recent VIX activity was actually worse than in any other crash tracked since 1990 putting it on par with the 2008 crash and in terms of volatility it was actually worse than 2008.
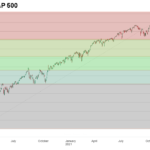
The Beginning of a Long-Term “Secular” Bull Market?
In the following article, Chris Ciovacco of Ciovacco Capital Management takes a look at the mood of the common investor as the outflows of equity funds reach new levels of pessimism. These levels are actually more pessimistic than in July 2016 when everyone was convinced that Hillary was going to be elected. They are even more pessimistic than at the depths of despair in March 2009 after the beginning of the “Great Recession”. So what is going on? ~ Tim McMahon, editor.
What Does this Rare & Rapid Drop in Manufacturing Mean?
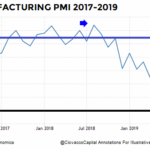
Purchasing managers are in a great position to judge the state of the economy (at least as far as their company goes). They know how much they sold last month, how much they expect to sell this month, year-ago sales, etc. What if you could aggregate all this information and develop an index that tells you where the economy is going? Well, that is exactly what the ISM Manufacturing index does and it has been around for over 100 years (since 1915 to be exact). So what is the ISM index currently telling us?
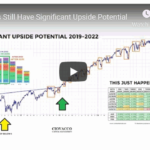
Bullish Signal Has Only Happened 10 Times in the Last 94 Years.
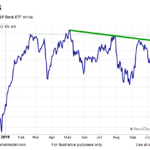
In today’s article by Chris Ciovacco of Ciovacco Capital Management Chris looks at a Bullish Signal that has only happened 10 times in the last 90 Years. Plus 8 charts that show a bullish break upward through resistance.
Trade, Impeachment, and the Conviction of Buyers and Sellers
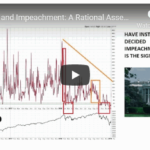
The following article by Chris Ciovacco looks at the impact the possibility of impeachment is having and could have on the stock market.
Almost Inverted Yield Dip Is Bullish for Stocks
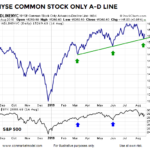
During the trading session on Monday, August 19, the “bottoming process” case for the stock market remained intact. The NYSE Common Stock A-D Line held the line last week at a logical level associated with the S&P 500 reversals in March and June (chart below).
Message from the Stock/Bond Ratio
The historical cases told us to be open to a period marked by bond underperformance relative to the stock market. Thus, it might be helpful to revisit the stock vs. bond topic as we near the end of July.