The following article by Chris Ciovacco looks at the impact the possibility of impeachment is having and could have on the stock market. ~Tim McMahon, editor
Rollover Process 2007-2008
Since every trade has a buyer and a seller, price action in the financial markets is determined by the conviction of buyers relative to the conviction of sellers. In the first half of 2007 (chart below), the conviction of buyers became stronger than the conviction of sellers allowing the S&P 500 to hold above the red 200-day moving average. In the second half of 2007, the conviction of sellers began to gain traction relative to the conviction of buyers causing the S&P 500 to stall and eventually drop decisively below the 200-day moving average.
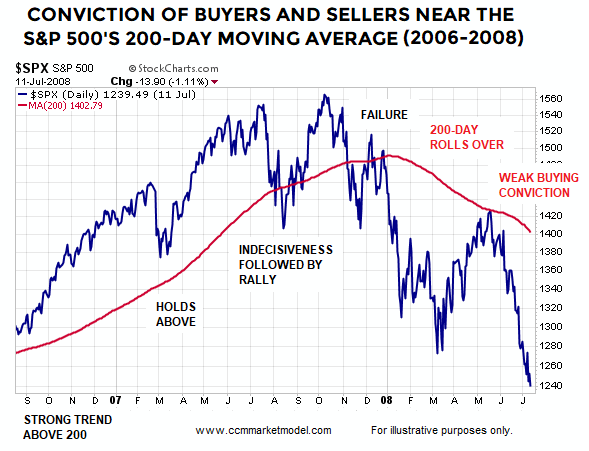
When the S&P 500’s trend rolled over in a decisive manner in 2008:
-
Price tended to stay below a downward-sloping 200-day moving average.
-
There was noticeable white space above price and below the 200-day.
Does the 2019 Chart Align with Gloom and Doom?
The right side of the 2006-2008 chart above looks quite a bit different from the present day S&P 500 chart shown below. In recent months, price has stayed above an upward-sloping 200-day moving average and there has been white space below price and above the 200-day.
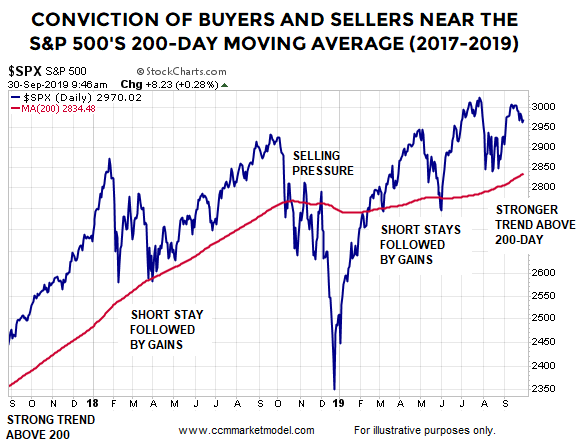
If we move from left to right on the chart above, the conviction of sellers was not strong enough in early 2018 to drive the S&P 500 below the red 200-day for a prolonged period. Institutions became more concerned in early October 2018 and selling conviction picked up considerably relative to buying conviction. Once price cleared the 200-day in Q1 2019, the conviction of sellers has not been strong enough to hold price below an upward-sloping 200-day.
It Has Been 119 Days Since…
In the end, bear markets begin when large institutions decide the fundamental issues of the day have reached a negative tipping point and it is time to head for the exits (as they did in Q4 2007 and in 2008). Large institutions have known about slowing global growth, yield curve inversion, trade tensions, and the threat of impeachment for some time now, and yet selling conviction from institutions has not been strong enough to drive the S&P 500 below the 200-day moving average for 119 calendar days.
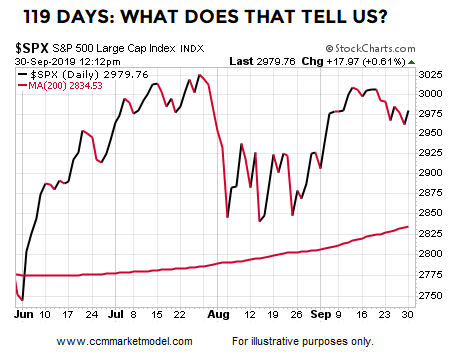
When institutions believe it is time to significantly reduce risk exposure, instead of having an S&P 500 chart with price above an upward-sloping 200-day, we will see an S&P 500 chart with price below a downward-sloping 200-day. That may happen in short order, but it has not happened yet.

Institutions are aware of impeachment odds.
You Can Decide With Fundamental And Technical Facts
This week’s stock market video addresses the following questions:
-
What are the odds President Trump is removed from office?
-
Are the credit markets screaming “imminent recession and imminent defaults?”
-
Is market breadth waving “pay attention” flags?
-
Do odds favor an ugly monthly labor report?
-
Are high-yield bonds acting like they did in 2007-2008?
Yield Curve Head Fakes in Britain
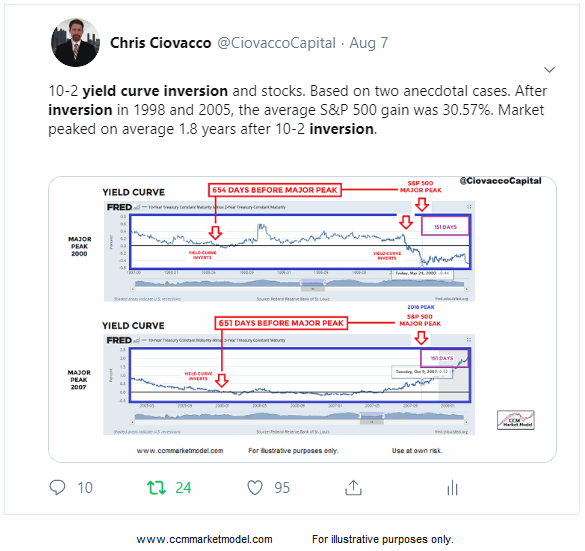
History tells us 10-2 year yield curve inversion is something that needs to be respected from a bearish/recession perspective. However, after the first sign of 10-2 yield curve inversion in the last two cycles, the S&P 500 gained an average of 30.57%.
The Wall Street Journal noted in an article, U.K. Experience Suggests an Inverted Yield Curve Isn’t All Gloom and Doom:
Every time the U.S. 10-year Treasury yield has sustained a drop below the three-month T-bill since the 1970s, a recession has followed. There have been no false positives.
In the U.K., a decline in the yield on 10-year gilts (as British government bonds are known) below the two-year has foretold the last three recessions in that country. (Yield curve analysis in Britain focuses on the two-year gilt on the short end.)
The U.K. yield curve also inverted in the mid- and late 1980s with no recession occurring soon after. It was inverted for the better part of 1998 to 2002. Recessions hit elsewhere, including the U.S. and Russia, but the U.K. economy held up and even boomed for some of that time, helping to earn the “Cool Britannia” nickname.
2019: Day by Day
Until the S&P 500 is able to break out convincingly and in a sustainable manner above 3025, it is extremely important under our approach to keep an open mind about all outcomes, from wildly bullish to wildly bearish. If the data shifts in a meaningful way, we must be open to reassessing bull/bear probabilities.
This article by Chris Ciovacco of Ciovacco Capital Management originally appeared here and has been reprinted by permission.
Other articles by Chris Ciovacco:
Speak Your Mind