Typically, investors see October as a tough month for the Stock market with “The Panic of 1907 (October 1907)”, Black Tuesday, Thursday and Monday (October 1929), and Black Monday (October 1987). But according to Investopedia September is actually just as bad with Black Friday (September 1869), Black Wednesday i.e. September 16, 1992, when the pound sterling crashed forcing Britain to withdraw from the European Exchange Rate Mechanism (ERM). September 2001 and 2008 each had single day point declines in the Dow that were bigger than Black Monday October 1987. A 2014 Business insider article stated that “the Dow October average over this timeframe is a modest 0.20%. There have been 64 monthly gains and 49 monthly losses. That’s calculates as a gain about 57% of the time.”
The following article by Chris Ciovacco of Ciovacco Capital Management compares market action in October 1987 to October 2018.
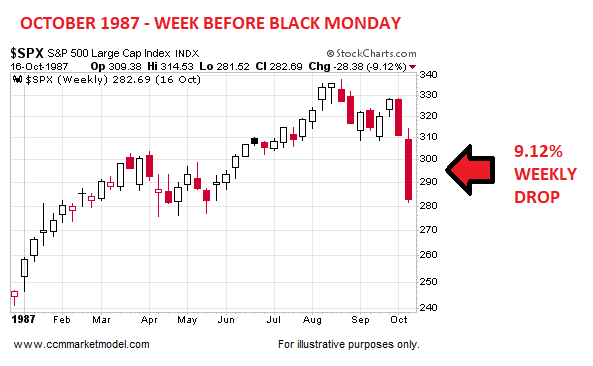
1987 Market Performance
The 1987 stock market crash occurred on Monday, October 19. The week before was marked by high fear and heavy selling, with the S&P 500 shedding 9.12% between Monday, October 12, and Friday, October 16, 1987.
2018: LAST WEEK
Over the past five sessions in 2018 the S&P 500 gained 0.02%.
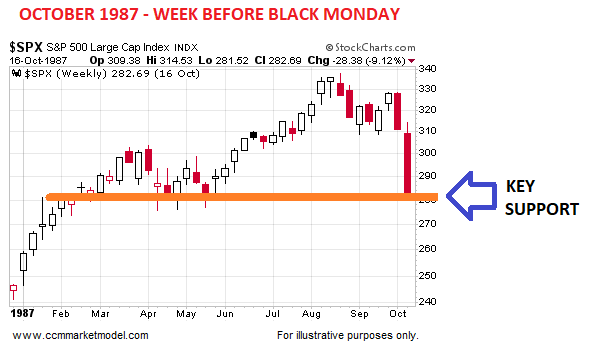
1987: KEY SUPPORT
On Friday, October 16, 1987, the S&P 500 was putting pressure on a key support level that was formed during a recent multi-month consolidation period.
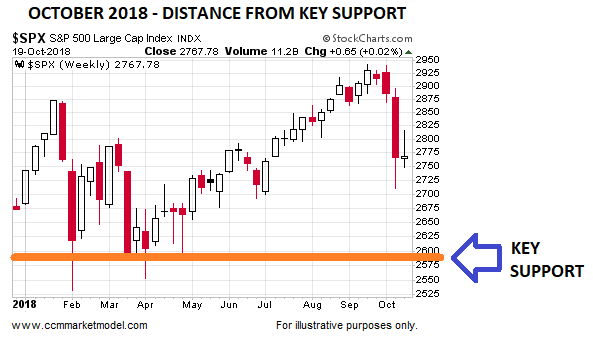
2018: KEY SUPPORT
Unlike the pre-Black-Monday close, the close on Friday, October 19, 2018 was well above a key area of possible support.
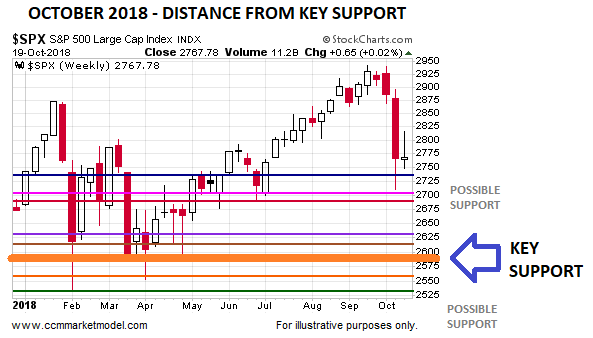
Why is the chart above relevant? Because in 1987, the market was in somewhat of a “make or break” posture before the 1987 crash. The present day market has numerous forms of possible support below price as outlined in detail on October 15. Therefore, the 2018 market has secondary forms of possible support above and below the key area of possible support (see chart below).
MORE DETAILS: 1987 VS. 2018
The opening segment of this week’s CCM stock market video takes the 1987 vs. 2018 comparison to another level of factual detail. The video also covers a key signal that has only occurred three times since 1934, comparisons to the 2000/2007 peaks, and reasons to keep an open mind about the stock market forming a bottom in the next 1-2 weeks.
This article originally appeared here and has been reprinted by permission.
You might also like:
Speak Your Mind