On 12/28/2022 the NASDAQ bottomed at 10,213.29 since then it has soared about 27% to 12,971 as of this writing. This happened despite the media beating the gloom and doom drum of the “Debt Ceiling”.
John Authers of Bloomberg published an article today entitled “Is Narrow Breadth Bad Breadth?”. In this article, he states that three stocks are all that carried the NASDAQ 100 higher on Tuesday. They were Nvidia, Tesla, and Apple with the other 97 stocks were down slightly. The article went on to address the issue of whether this narrow breadth was actually bad, and his conclusion was, “not necessarily”. Typically there are a few leaders that lead the pack. “One of the points of diversification is to improve your chance of holding the best performers in the index. If the index returns are narrow, it only enhances the case for diversifying.”
He goes on to quote Mimi Duff, managing director at GenTrust.
“It feels extreme right now, because we’re seeing some of these tech stocks carrying everything, but over a long time period, it is absolutely the case that a narrow sleeve carries the equity returns,” she said in an interview. “That’s just another reason to be long indices. It’s really going to be hard to pick the winners in advance.”
NASDAQ Composite Index
Looking at the full NASDAQ (not just the top 100 stocks) we see a strong move upward so far in 2023.
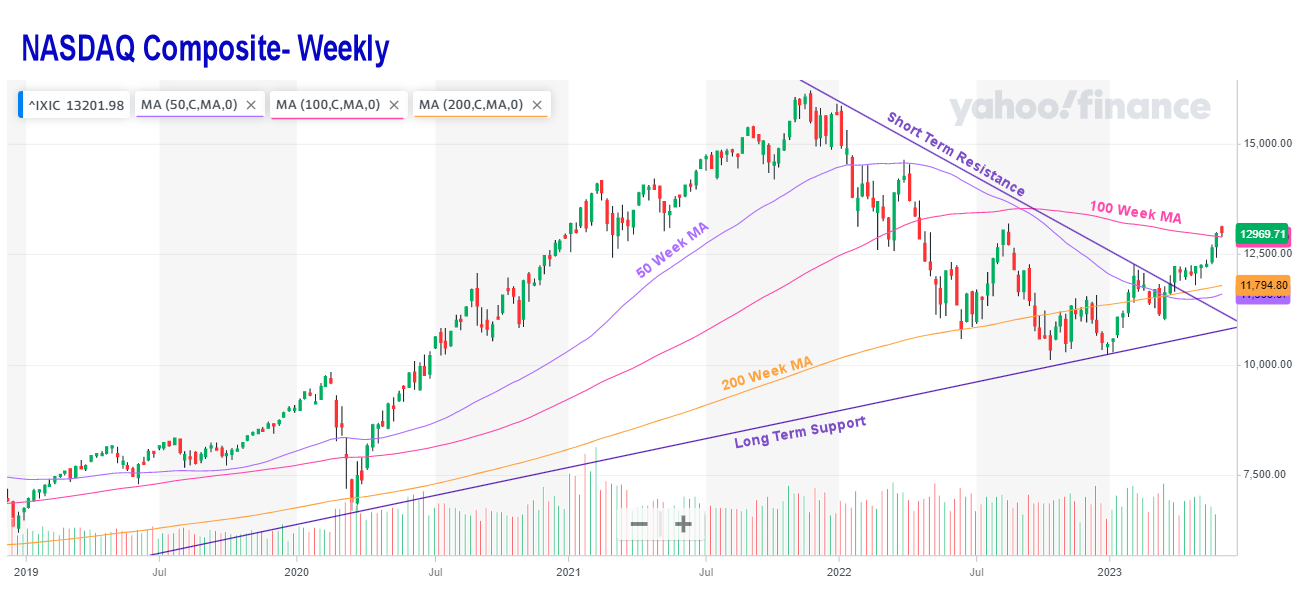
The current week although currently red (negative) is also above the 100-week moving average. And unlike the NYSE, the NASDAQ broke out of its “pennant” i.e. above the short-term resistance, months ago. The big buzz about A.I. is dragging the market higher. This indicates that market psychology is positive. When the market psychology is negative, nothing creates a buzz no matter how promising.
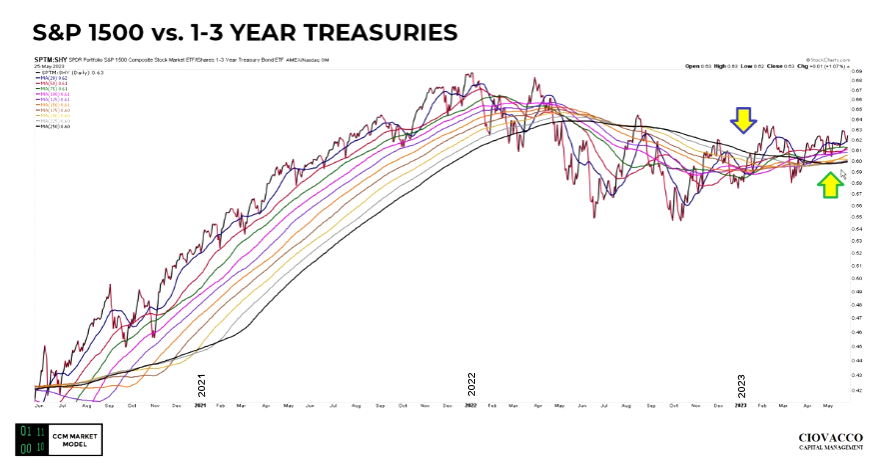
S&P 1500 vs Treasuries
Chris Ciovacco in his short takes video compares the broad S&P market to treasuries. He says if the market was expecting the economy to tank and corporate earnings to go down, this ratio would be in a downtrend (since market participants would rather hold treasuries). But recently, the ratio has turned up, indicating a positive climate for the market.
Technology is Heating Up
Chris also compares T-Bills vs Tech. Showing us a unique situation not seen since 2009. Short-term T-Bills are basically the equivalent of cash and have surprisingly outperformed tech stocks since 2009. But now that situation is changing…
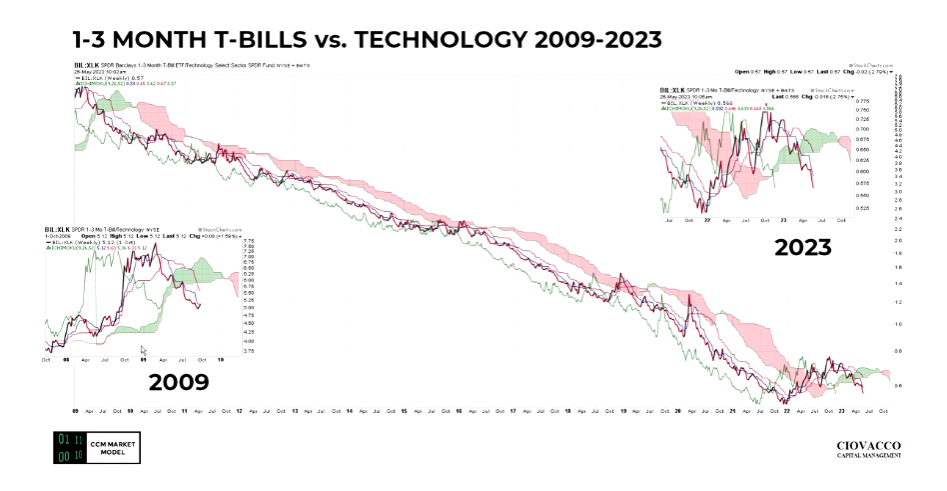
Prior to the NVIDIA news last week Tech looked like it was going to have a failed breakout but then the blockbuster NVIDIA news gave tech stocks the push they needed to break out above resistance.
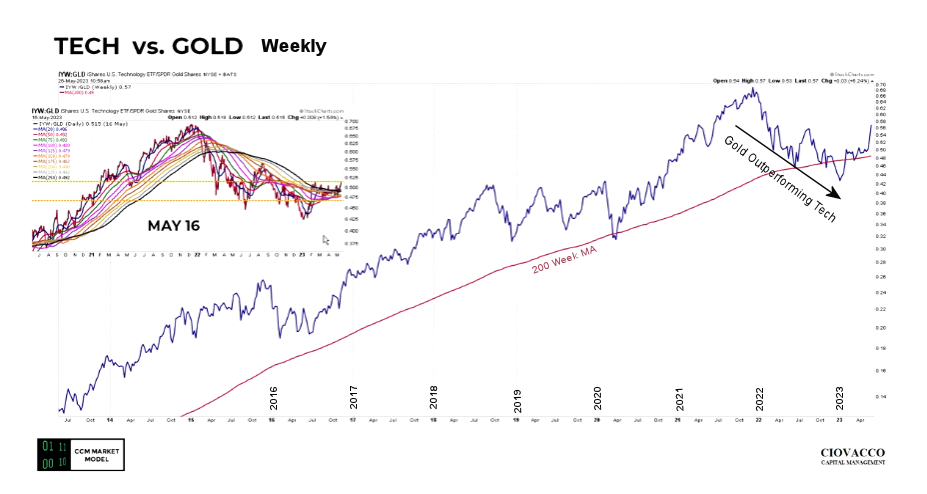
We also see tech stocks turning up vs. “GLD” Shares.
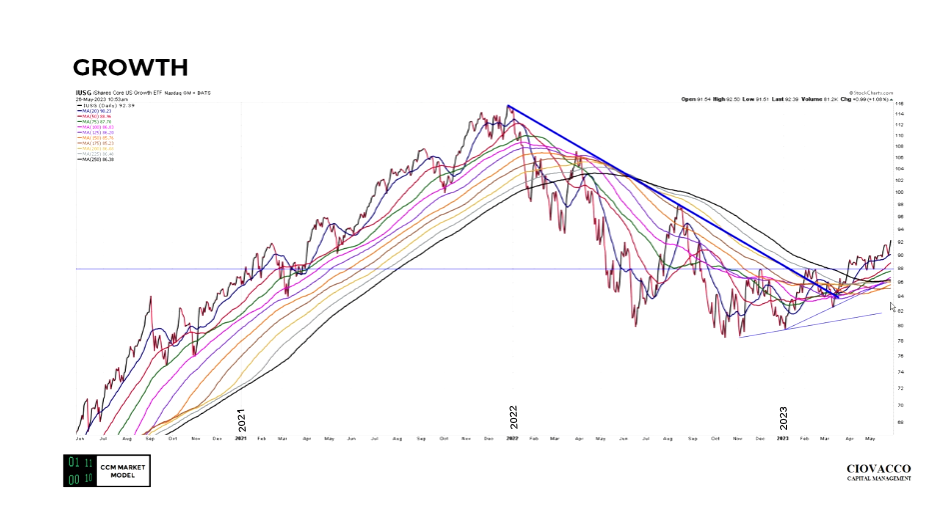
Growth Stocks
We can see that growth stocks look like they are turning up in 2023 after falling in 2022.
At the moment the market looks positive, the caveat is that we are entering the “Summer Doldrum” period. The old market adage is “Sell in May and go Away” so it is still possible that the Summer will take a breather and travel sideways for a while. This could provide a more relaxed buying opportunity, although there have been summers that have not followed the standard pattern.
If you’d like to watch Chris Ciovacco’s full video commentary, it is available here.
You might also like:
Speak Your Mind