As we’ve been saying for a while now, the market is stuck in a pennant formation and will eventually have to break out one way or the other, and generally, when that type of breakout occurs, it is quite sharp.
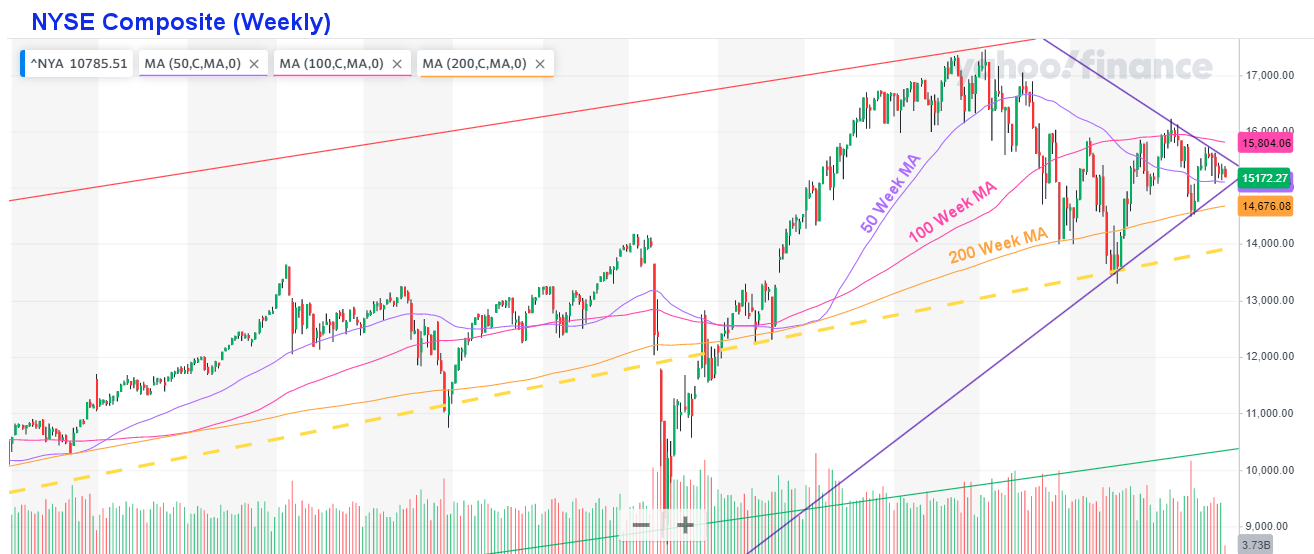
The index remains above its 50-week moving average (MA), indicating that the market is improving over where it was last year. But being below its 100-week average shows that it is not as healthy as two years ago either. But longer term, we are still above the 200-week moving average.
A few days ago, in his Short Takes video, Chris Ciovacco showed that the market was consolidating above a series of support lines on this daily chart.
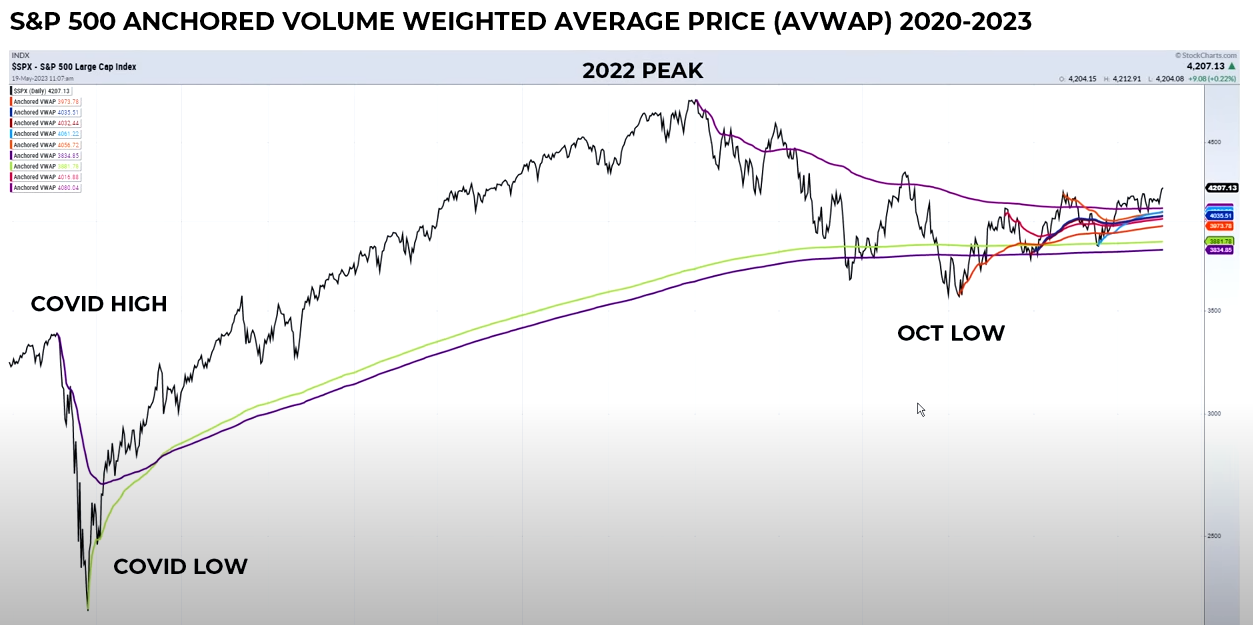
He says that as long as the S&P 500 holds above 4080, we probably don’t have anything to worry about. As of this writing, it is 4,145.58.
Chris presented an interesting plot chart of Inflation vs. Unemployment and how likely a “Pivot” is. (A pivot occurs when the FED changes direction from tightening to loosening or vice versa).
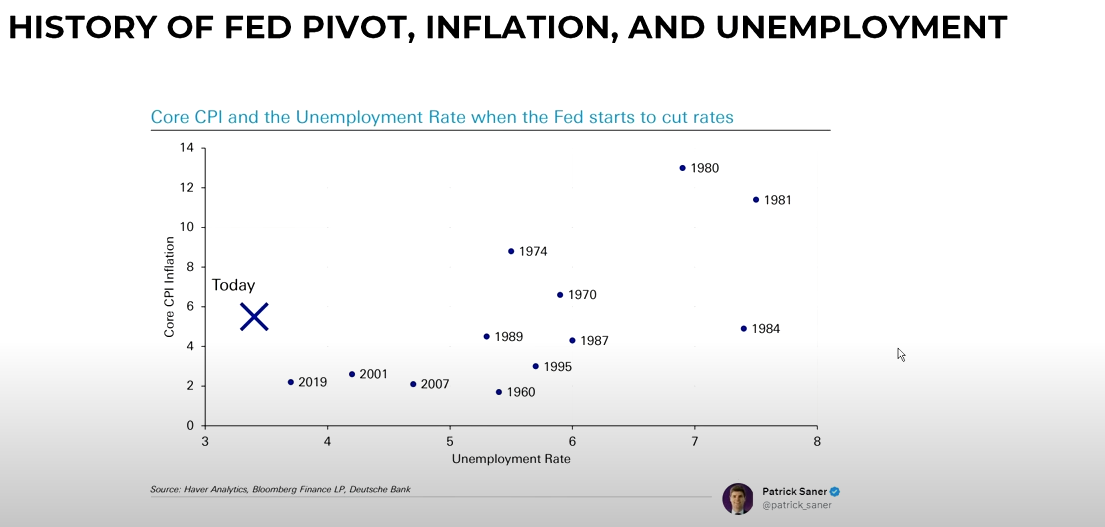
Typically what is going to force the FED’s hand toward loosening is high Unemployment. And we are at the extreme low end of unemployment, so there is no reason for the FED to stop fighting inflation at this point. Although a tight FED is typically a bearish sign, the low unemployment levels mean the economy is still humming along, which should be good for the market.
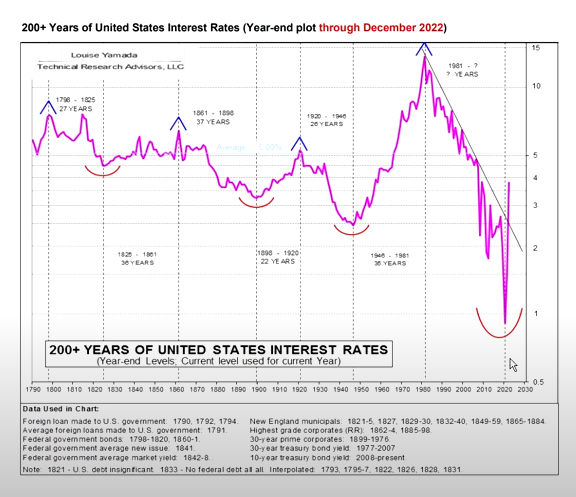
Chris showed the chart of 200 years of U.S. interest rates, and we can see that they have been trending down since 1980, making an extreme low during COVID. But now they have broken above the downward-sloping trendline.
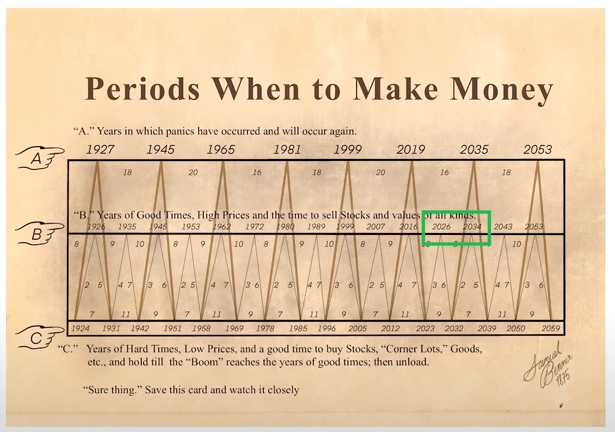
Based on this long-term cyclical chart, 2023 is a good time to buy stocks, with the next major peak not expected until 2034-5.
Fund managers are heavily weighted toward caution, probably because they fear an imminent recession. But looking at the data, we don’t really see anything that is screaming recession, and as we said earlier, the unemployment levels are quite the opposite.
Breadth Indicator Turns Positive
Beginning at the 10:41 point in Chris’ video, he covers a breadth indicator that typically “fires” at market bottoms, including 1988, 1991, 1995, 2002, 2009 2016, and 2019. And now again in 2023. On average, when this indicator fires, the market is 10% higher a year later, 26% higher three years later, and a whopping 57% higher five years later.
True Strength Index
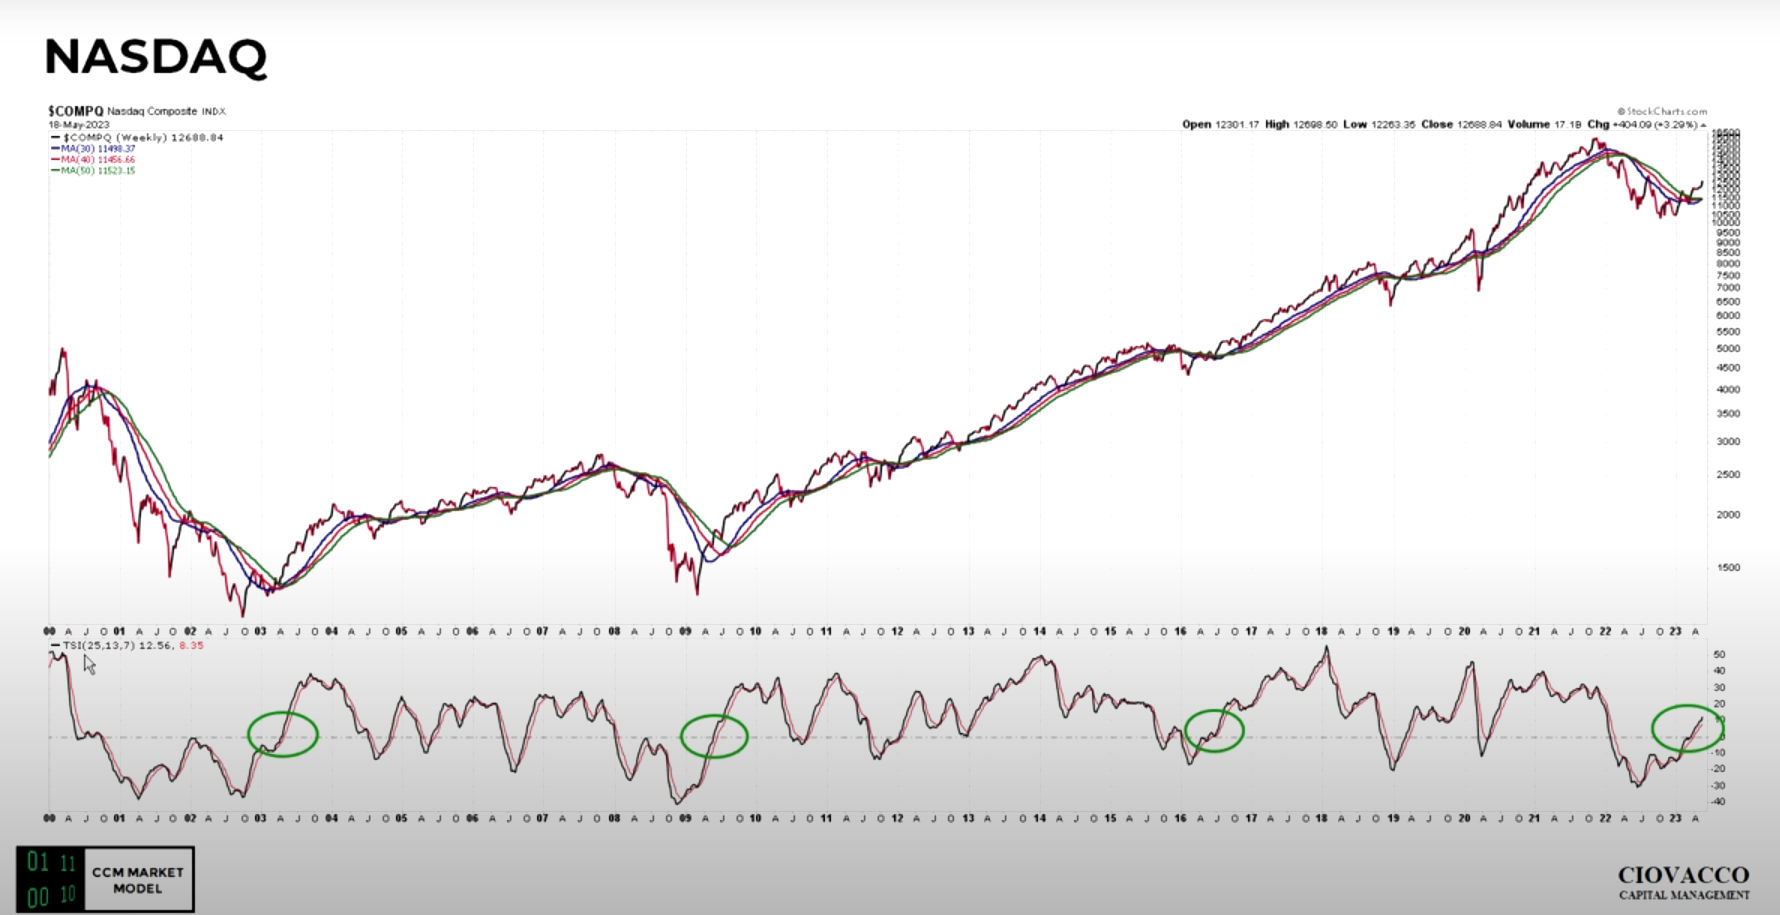
Looking at the NASDAQ True Strength Index (TSI), the green circles represent good buying opportunities, and according to this indicator, we are in one of those periods right now. In the very short term, we can expect some consolidation after last week’s strong move upward in the NASDAQ. But that could very well be a good buying opportunity.
In the following Ichimoku cloud chart of the S&P 500, we see the cloud turning green in the last few weeks and the black line moving above the red cloud. Both are bullish signals.
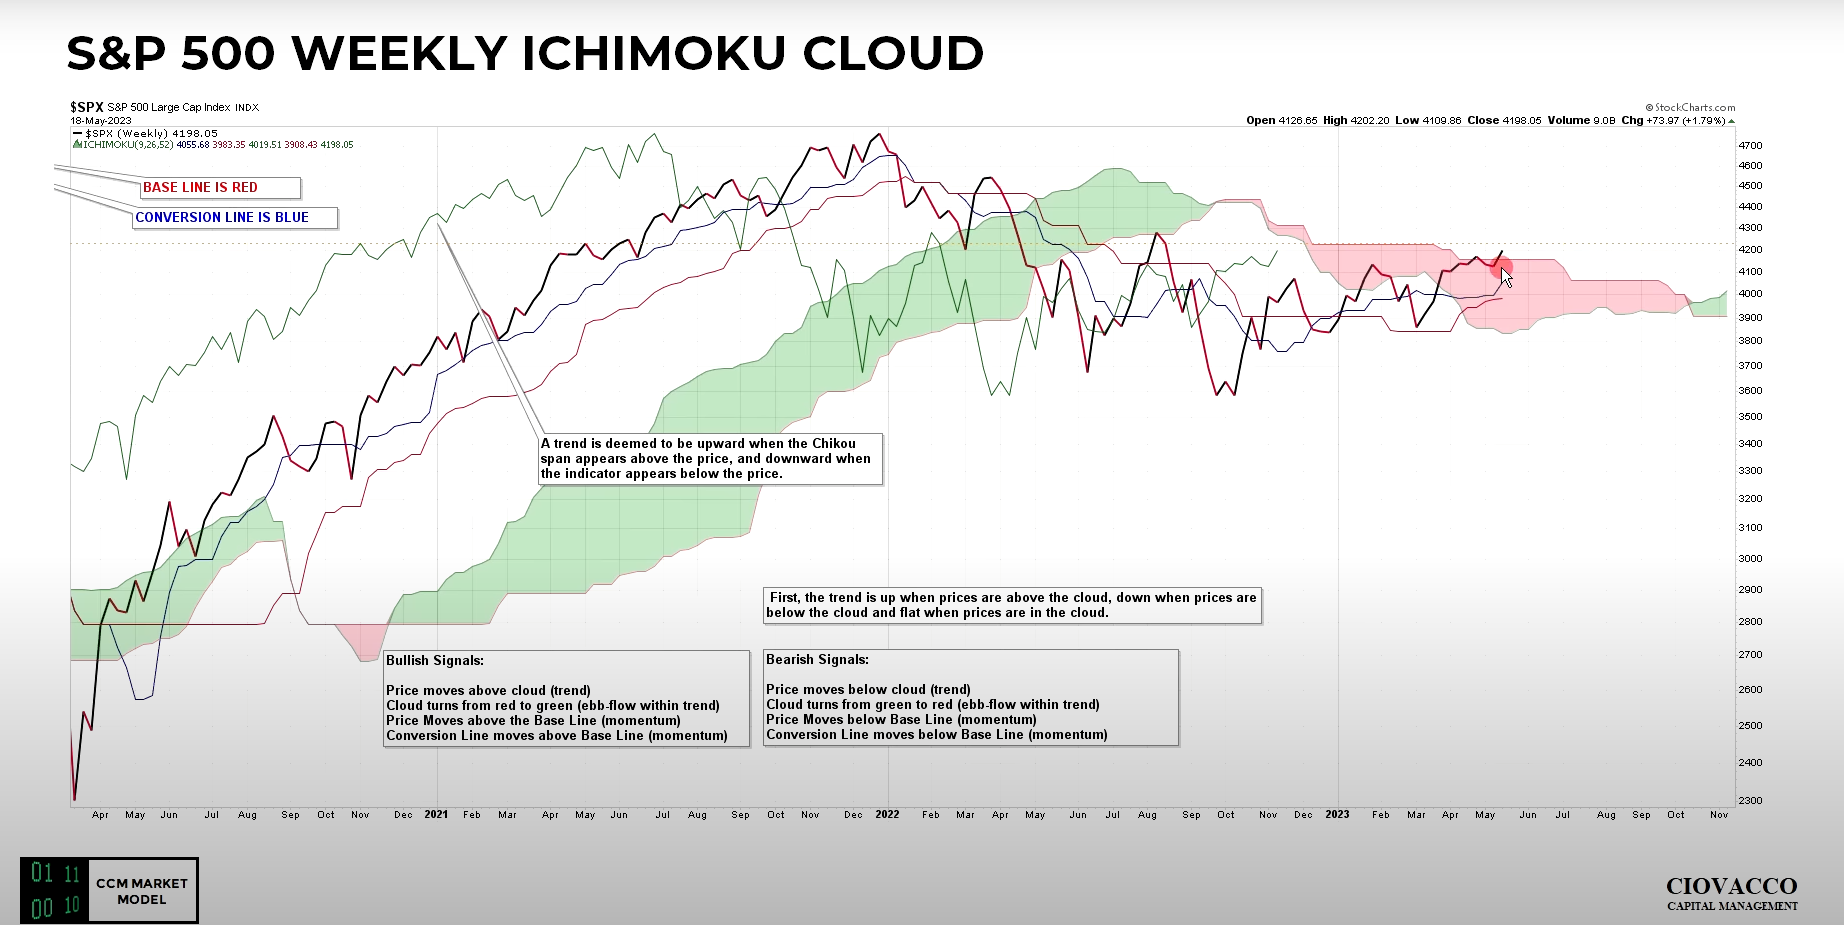
- Momentum on the S&P 500 also looks good.
- Apple stock is also looking much improved.
- Foreign stocks are looking much healthier compared to intermediate-term treasuries.
- Home Builders are also looking better than treasuries
- Russell 1000 is looking good.
- Tech is looking good.
- With Inflation more concerning than recession at this point, Bonds are not the place to be.
- Remember that we have already seen a 27% correction last year which could be all there is.
See Chris Ciovacco’s full video here.
You might also like:
Speak Your Mind