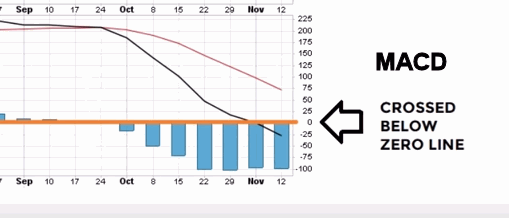
 Fifteen times in Forty-Two years is about once every 8½ years. That makes it a relatively rare occurrence. In today’s video, Chris Ciovacco of Ciovacco Capital Management looks at the recent MACD cross. The first MACD cross which occurred in September 2018 reveals the beginning of a countertrend movement in the prevailing uptrend. But when the “black” MACD line crossed below the zero line in November we get what looks like a confirmation of the switch from a countertrend movement to a full downtrend movement.
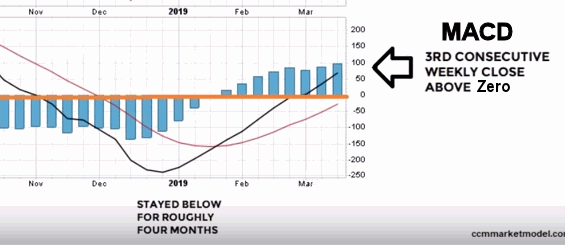
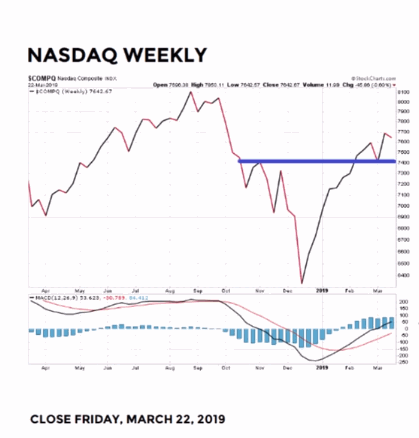
But on March 8th 2019, we see the “black” MACD line crossing back above the zero line. Thus we see the relatively rare signal as follows, “MACD crosses below the centerline on a weekly closing basis and stays below for at least 3.5 to 4 months, and then closes back above the zero line”… this makes it look more like a new uptrend rather than a countertrend rally.
Did Something Similar Ever Happen During Previous Bear Markets?
If the answer is NO then the 2019 market is starting to distance itself from the theory that this is a counter-trend move in an existing bear market. Did we ever get 3 consecutive weekly closes back above the center-line during the dot-com bear market (2000-2002)? The answer is a definitive no. During this time period MACD can never even get 1 week closing above zero. What about during the 2007-2009 bear market? Once again, during the bear market in no time did we ever see 3 consecutive weekly closes back above the center-line, as a matter of fact we don’t get a single weekly close above the zero line. So the odds are more in favor of good things happening than of bad things happening at this point but it is no “guarantee” that we are out of the woods yet. But it is looking more like a sustainable up move rather than a counter-trend rally.
If this didn’t happen in the two most recent bear markets how often has it happened since the creation of the NASDAQ in the 1970’s? And what happened next?
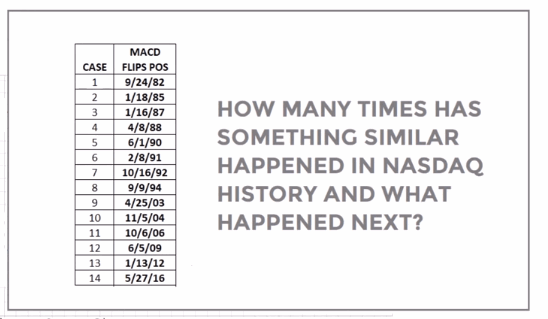
There have been 14 similar setups since the inception of the NASDAQ. The average gain of all 14 cases over the next year was 24.41%, with only one of the 14 seeing a loss over the year. Over two years the average gain was 32.03% with two losses and after 3 years the average gain was 50.32% with only one loss.
Inverse Head and Shoulders Pattern?
This pattern looks promising.
This information comes from the March 22nd “Short Takes” by Chris Ciovacco of Ciovacco Capital Management and has been reprinted by permission. You can watch the full discussion below.
You might also like:
Speak Your Mind