
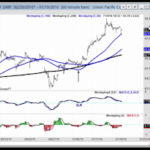
Fifteen times in Forty-Two years is about once every 8½ years. That makes it a relatively rare occurrence. In today’s video, Chris Ciovacco of Ciovacco Capital Management looks at the recent MACD cross. The first MACD cross which occurred in September 2018 reveals the beginning of a countertrend movement in the prevailing uptrend. But when the “black” MACD line crossed below the zero line in November we get what looks like a confirmation of the switch from a countertrend movement to a full downtrend movement.
But on March 8th 2019, we see the “black” MACD line crossing back above the zero line. Thus we see the relatively rare signal as follows, “MACD crosses below the centerline on a weekly closing basis and stays below for at least 3.5 to 4 months, and then closes back above the zero line”… this makes it look more like a new uptrend rather than a countertrend rally.
NASDAQ Signal Has Only Occurred 15 Times In Last 42 Years
Learning to Recognize Trade Setups with “MACD”
According to Investopedia – the Moving Average Convergence Divergence (aka. MACD) is a trend-following momentum indicator that shows the relationship between two moving averages of prices. The MACD is calculated by subtracting the 26-day exponential moving average (EMA) from the 12-day EMA.
Top Technical Tools and Videos:Candlesticks, RSI & MACD
Enhance your trading confidence with this lesson on how the top technical tools Japanese Candlesticks, RSI and MACD By Elliott Wave International “Guessing or going by gut instinct won’t work over the long run. If you don’t have a defined trading methodology, then you don’t have a way to know what constitutes a buy or […]
Momentum Analysis Using MACD
Learn more about using Momentum analysis to make Elliott wave trading decisions in this video by EWI European Interest Rate Analyst Bill Fox. Find more lessons on technical indicators in EWI’s newest free report. See the information below.