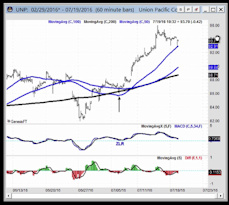
According to Investopedia – the Moving Average Convergence Divergence (aka. MACD) is a trend-following momentum indicator that shows the relationship between two moving averages of prices. The MACD is calculated by subtracting the 26-day exponential moving average (EMA) from the 12-day EMA.
 MACD was developed by Gerald Appel in the late nineteen-seventies. Stockcharts puts it this way: The MACD turns two trend-following indicators, moving averages, into a momentum oscillator by subtracting the longer moving average from the shorter moving average. As a result, the MACD offers the best of both worlds: trend following and momentum. The MACD fluctuates above and below the zero line as the moving averages converge, cross and diverge. Traders can look for signal line crossovers, centerline crossovers and divergences to generate signals. Because the MACD is unbounded, it is not particularly useful for identifying overbought and oversold levels… The MACD Line oscillates above and below the zero line, which is also known as the centerline. These crossovers signal that the 12-day EMA has crossed the 26-day EMA. The direction, of course, depends on the direction of the moving average cross. Positive MACD indicates that the 12-day EMA is above the 26-day EMA. Positive values increase as the shorter EMA diverges further from the longer EMA. This means upside momentum is increasing. Negative MACD values indicates that the 12-day EMA is below the 26-day EMA. Negative values increase as the shorter EMA diverges further below the longer EMA. This means downside momentum is increasing.
In the following video Jeffrey Kennedy shows you how to use MACD to indicate trade setups. ~Tim McMahon, editor
MACD: Learn to Recognize Trade Setups
See examples in Pfizer, Inc. (PFE) and Intel Corp. (INTC)
By Elliott Wave International
Just as there are patterns in price, there are also patterns in momentum indicators. These patterns can support your Elliott wave analysis and help you identify tradable moves in price.
In this 10-minute lesson from our popular trader-education service, Trader’s Classroom, editor Jeffrey Kennedy shows you key patterns in moving average convergence divergence (MACD).
You’ll see examples from the charts of Pfizer, Inc. (NYSE: PFE), Intel Corp. (Nasdaq: INTC), NVIDIA Corp. (Nasdaq: NVDA), and more.
Learn How You Can Find High-Confidence Trading Opportunities Using Moving AveragesMoving averages are one of the most widely-used methods of technical analysis because they are simple to use, and they work. Learn how to apply them to your trading and investing with this free 10-page eBook from Trader’s Classroom editor Jeffrey Kennedy. |
This article was syndicated by Elliott Wave International and was originally published under the headline MACD: Learn to Recognize Trade Setups. EWI is the world’s largest market forecasting firm. Its staff of full-time analysts led by Chartered Market Technician Robert Prechter provides 24-hour-a-day market analysis to institutional and private investors around the world.
Speak Your Mind