Nobody likes minus signs and red screens, which create a feeling of being out of control. While hitting a sell button can make us feel like we are back in control, it often leads to overtrading and disappointing returns.
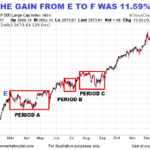
Learning to Recognize Trade Setups with “MACD”
February 2, 2017 by Leave a Comment
According to Investopedia – the Moving Average Convergence Divergence (aka. MACD) is a trend-following momentum indicator that shows the relationship between two moving averages of prices. The MACD is calculated by subtracting the 26-day exponential moving average (EMA) from the 12-day EMA.
How Does 2016 Compare To Stock Market Peaks In 2000 And 2007?
August 15, 2016 by Leave a Comment
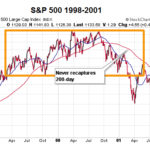
How does the current 50 day and 200 day moving average on the S&P 500 compare from previous crashes with the current market situation?