
In his latest weekly market video, Chris Ciovacco of Ciovacco Capital walks through a broad set of technical charts and indicators to answer one key question: do current market conditions align with a bottoming process in stocks? After the S&P 500 gained over 3% in the past five trading sessions, the evidence continues to lean toward “so far, so good” — with breadth indicators, credit markets, and key moving averages all holding at critical support levels. While short-term hurdles remain, the weight of evidence looks far more like the corrections of 2023 and early 2025 than the bear market of 2022. Watch the full video breakdown below.
Is Dow Theory Telling Us The Stock Rally Is Going To Fail?
August 27, 2016 by Leave a Comment

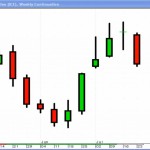
The Dow Jones Transportation Average has failed to print a new high above the previous high made in 2015. Given the Dow has made a new high, a Dow Theory non-confirmation remains in effect.
Technical vs. Fundamental Analysis? The Winner is…
September 10, 2015 by Leave a Comment
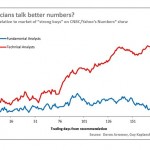
Technical versus fundamental analysis: Which approach yields better investment results? A new study by three finance professors offers an answer.
The focus of their study were a thousand pairs of recommendations made between November 2011 and December 2014 on the TV show “Talking Numbers” … The first half of each pair was a recommendation from a top technician about a stock in the news; the second half was a recommendation about that same stock from a leading fundamental analyst.
How to Use the Stochastic Oscillator
July 24, 2015 by Leave a Comment
The stochastic oscillator is a popular tool for analyzing a market. Watch the video to learn how you can use this indicator in your trading. Another way to use Stochastic is as a trend analysis tool. In the following video Jeffrey gives a good explanation of the terms “overbought” and “oversold”. He says these two terms are responsible for more lost money among rookie traders than anything else. So watch the video and get some great tips on using stochastics in your trading.
Top Technical Tools and Videos:Candlesticks, RSI & MACD
April 30, 2013 by 1 Comment
Enhance your trading confidence with this lesson on how the top technical tools Japanese Candlesticks, RSI and MACD By Elliott Wave International “Guessing or going by gut instinct won’t work over the long run. If you don’t have a defined trading methodology, then you don’t have a way to know what constitutes a buy or […]
Technical Analysis
October 15, 2012 by
Technical Analysis- Despite the fancy and sophisticated tools it employs, technical analysis at its very core is a study of the market’s supply and demand to determine the price movement of a stock or other underlying asset in the future. Technical analysis premise rests on 3 theorems: The market discounts everything. An asset’s price moves […]
S&P 500: Did the 13.74-Point Rally Finish the Move?
June 20, 2012 by Leave a Comment
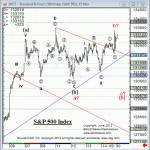
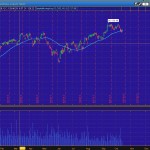
Here’s what Elliott wave analysis is all about: You study charts to find non-overlapping 5-wave moves (trend-defining) from overlapping 3-wave ones (corrective, countertrend). With that in mind, please take a look at this chart of the S&P 500. Immediately, you can see that the S&P 500 has been moving sideways in a choppy, overlapping manner. […]
Forex Trading Software
June 12, 2012 by 3 Comments
Trading Forex Many investors in recent years have decided to branch out and venture into the foreign exchange market as a way to diversify their investment strategies, and bring in extra profits. If you’ve been thinking about investing in the Forex market, there are several concepts that you have to understand before you can have […]
Trading the Line
May 21, 2012 by 1 Comment
How a Simple Line Can Improve Your Trading Success Elliott Wave International’s Jeffrey Kennedy explains many ways to use this basic tool The following trading lesson has been adapted from Jeffrey Kennedy’s eBook, Trading the Line — 5 Ways You Can Use Trendlines to Improve Your Trading Decisions. You can download the 14-page eBook here. […]
How to Identify and Use Support and Resistance Levels
December 20, 2011 by Leave a Comment
Since 1999, Elliott Wave International senior analyst and trading instructor Jeffrey Kennedy has produced dozens of Trader’s Classroom lessons exclusively for his subscribers. While commodity markets are known as some of the toughest trading environments around, these actionable lessons from a skilled veteran can help you trade commodities, or any market for that matter, with […]