
In his latest weekly market video, Chris Ciovacco of Ciovacco Capital walks through a broad set of technical charts and indicators to answer one key question: do current market conditions align with a bottoming process in stocks? After the S&P 500 gained over 3% in the past five trading sessions, the evidence continues to lean toward “so far, so good” — with breadth indicators, credit markets, and key moving averages all holding at critical support levels. While short-term hurdles remain, the weight of evidence looks far more like the corrections of 2023 and early 2025 than the bear market of 2022. Watch the full video breakdown below.
Spotting High-Confidence Trading Opportunities
September 26, 2019 by Leave a Comment
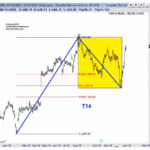
You know that there are hundreds of technical indicators out there. Sometimes you may have so many flashing signals on your screen that it looks like the motherboard of the Starship Enterprise. Here’s help in choosing the right one. In this free video lesson, the editor of Elliottwave International’s “Trader’s Classroom” service shows his favorite moving average pattern: the “Pinch.”
Moving Averages Help You Define Trend – Here’s How
August 23, 2018 by Leave a Comment
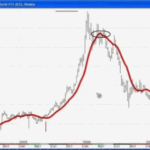
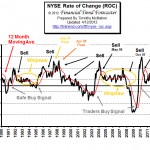
The “moving average” is a technical indicator of market strength which has stood the test of time.
Navigating A Fed-Dependent Market
June 18, 2013 by 1 Comment
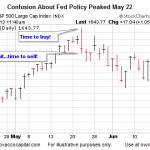
Experienced traders and investors respect and understand the concept of “Don’t fight the Fed”. The basic rationale behind the expression is that when the Fed is printing money, the odds are tilted in the bulls’ favor. Conversely, when the Fed is tightening policy, bearish odds begin to pick up. What Fight Are We Trying To […]
Moving Averages Can Identify a Trade
February 1, 2013 by Leave a Comment
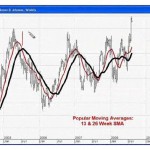
These 3 charts help you understand how moving averages work Moving averages are a popular tool for technical traders because they can “smooth” price fluctuations in any chart. EWI Senior Analyst Jeffrey Kennedy gives a clear definition: “A moving average is simply the average value of data over a specified time period, and it is […]
What Are Moving Averages and Why Should Investors Care?
November 27, 2012 by
The stock market, and the lingo associated with it, might as well be a foreign language to most Americans. Most people are not even sure how the stock market works or what it means, let alone what a “moving average” is. Simply, put a moving average is exactly what it implies: the average rate at […]
Moving Averages and the Elliott Wave Principle
November 2, 2012 by
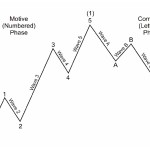
Improve your Elliott wave pattern identification skills with this lesson By Jeffrey Kennedy / Elliott Wave International Moving averages are one of the most widely-used methods of technical analysis because they are simple to use, and they work. Among Elliott wave traders, you will likely find an especially high percentage of investors and traders who incorporate […]
What is a Moving Average?
May 7, 2012 by 3 Comments
Investing Using Moving Averages When investing in financial markets, there are many different indicators and systems that you can use to determine when to enter into a position, and just as importantly, when to exit a position. One of the most popular indicators that investors employ to help make intelligent decisions are moving averages. What […]
Using Moving Averages To Improve Your Trading
June 14, 2011 by Leave a Comment
The Trend Is Your Friend: Using Moving Averages To Improve Your Trading By Elliott Wave International Many traders and investors use technical indicators to support their analysis. One of the most popular and reliable also happens to be an indicator that has been around for years and years — moving averages. A moving average is […]
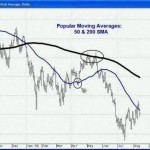
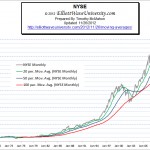
DJIA’s 200-Day Moving Average: Will the Dow stay above or below this demarcation line?
June 23, 2010 by Leave a Comment
Moving averages are one of the most widely followed indicator in technical analysis. Simply put, when the price of an index or stock stays above a particular price moving average line on a chart, that price level serves as support — a level where buyers reside. If the price falls below a moving average line […]