
Math plays a big role in nature and the financial markets. Many trading algorithms use Fibonacci retracement levels to identify areas where buyers may become interested (support). The math below may be helpful to us in the coming days – at a minimum, it is prudent to be aware of the possibility of a bounce near 1976 should the market test that area:
Market Trends Diverging
January 8, 2015 by 1 Comment
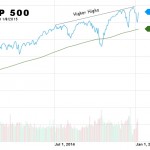
Today we are going to take a look at two common stock market charts that individually tell opposite stories but when combined give us an interesting insight into the overall market. The first chart is the S&P 500. As I’m sure you are aware the S&P 500 represents Standard and Poor’s top 500 companies.