Rare Signal In 1982 and 2016
A December 2016 video covered an extremely rare signal that occurred in 1982 and 2016. Since then, markets have reacted in a bullish manner, meaning we have no reason to doubt the long-term signal that occurred at the end of 2016. Therefore, it may be helpful to understand the stock market’s volatility profile between 1983 and 1985.
Early Stages of a Secular Bullish Trend
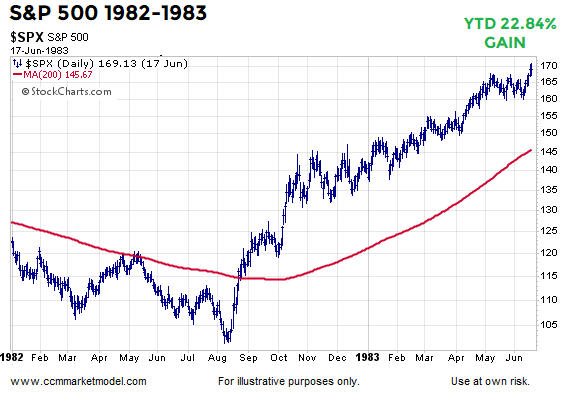
While there are numerous fundamental differences between the early 1980s and 2016-2018, both periods experienced a breakout from a long-term period of consolidation. Was it easy to stay with the new secular bullish trend that began in 1982 and continued into calendar year 2000? 1983 started strongly with the S&P 500 posting a YTD gain of over 22% in early June.
Push Back Toward 200-Day
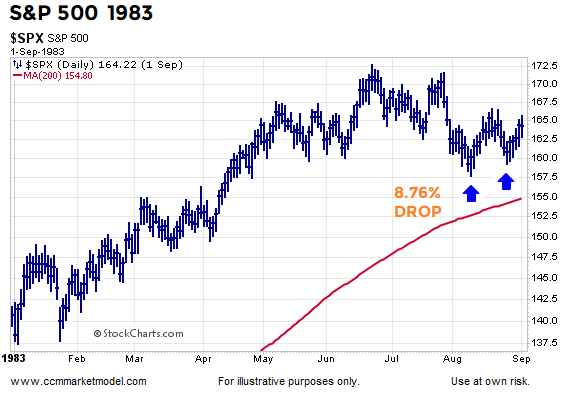
The early gains were followed by an 8.76% drop that featured a double-bottom above an upward-sloping 200-day moving average.
Rally to New High
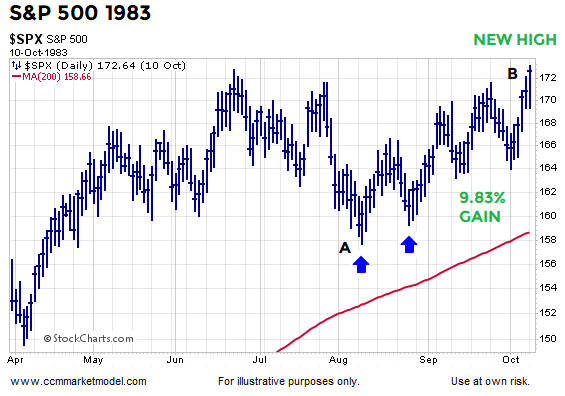
Stocks then pushed higher for a couple of months and exceeded the previous high.
Markets Are Difficult and Volatile
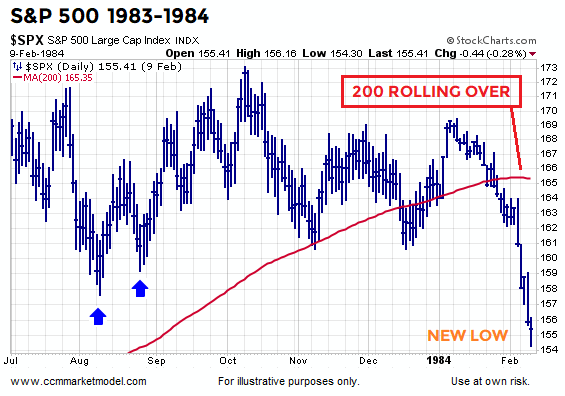
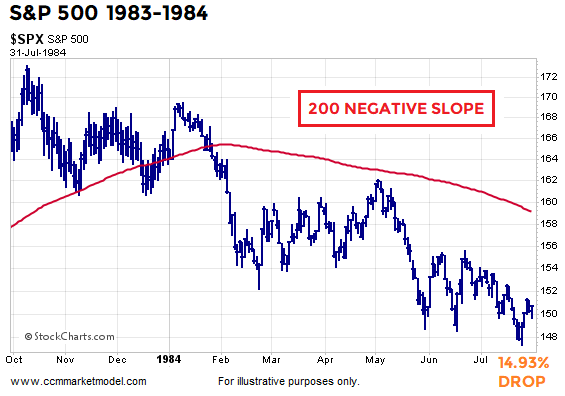
The push to new highs was short-lived and stocks continued their volatile and erratic behavior. Two yellow flags eventually started waving with the slope of the 200-day moving average rolling over and price posting a new low.
Another Leg Down
Looking out a few months, the S&P 500 remained below a downward-sloping 200-day moving average for an extended period. The drop from the prior peak hit 14.93% in July 1984. Far from easy.
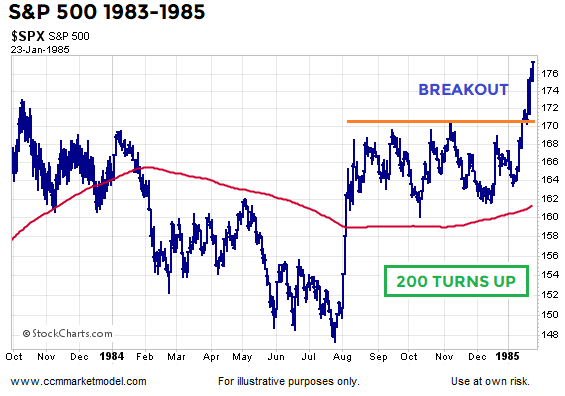
Sharp Reversal
Some “things are looking better” boxes were checked over the next few months: (a) price recaptured the 200-day, (b) the slope of the 200-day turned back up, and (c) the S&P 500 broke out from a multiple-month period of consolidation.
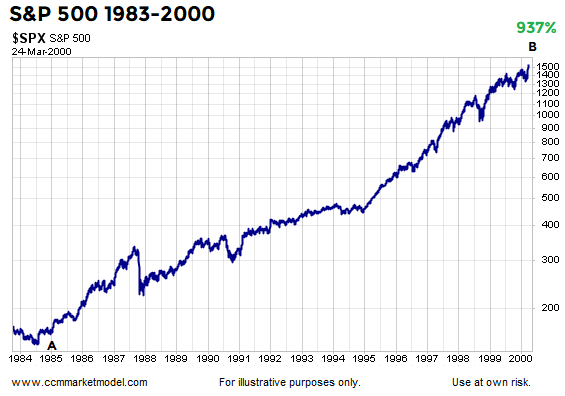
Flexibility and Patience Were Rewarded
Given the wild swings and gut-wrenching corrections, it would have been easy to throw in the towel and pronounce that the bears were the winners numerous times between June 1983 and August 1984. That would have been an extremely unfortunate mistake given the secular trend tacked on an additional 937% following the low in July 1984.
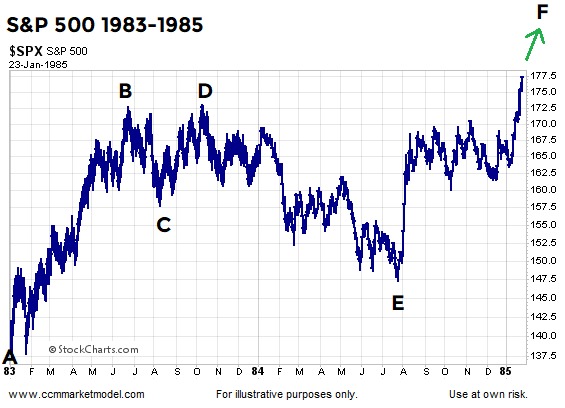
Markets Are Volatile and Difficult
There was a ton of volatility between point A and point E below, making it very difficult to successfully trade on a short-term basis. The volatility also made it extremely taxing on those watching the markets and their balances too closely.
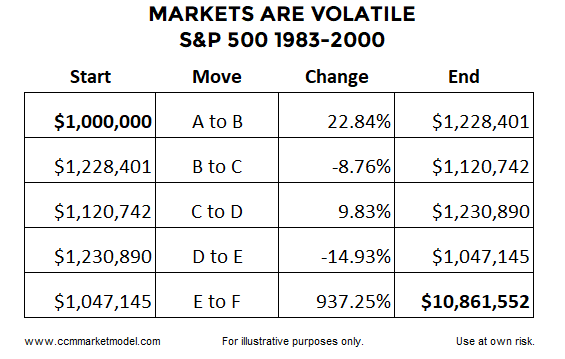
A Longer-Term Perspective
The table below helps put volatility and the drawdowns of 8.76% and 14.93% in a longer-term context. A hypothetical $1,000,000 portfolio invested in the S&P 500 on 12/31/1982 would have grown to over $10 million in the spring of 2000.
Moral Of The Story
- Markets are difficult.
- Volatility is a normal part of all trends.
- Monitoring multiple timeframes can help keep swings in perspective.
- In the early stages of a new secular trend, a significant shakeout is well within the realm of possibility.
- The severity of the shakeout may cause serious and prudent doubt about the longer-term bullish case.
- It is not possible to participate in very satisfying and profitable long-term trends without periodically feeling very uncomfortable.
- Drawdowns, give-backs, and corrections are normal and to be expected.
- Flexibility and nimbleness are key to balancing the need to protect capital from time-to-time and the desire to participate in the extremely satisfying gains secular trends can offer.
Present Day Big Picture
As outlined in the second half of this week’s video (12:30 mark), given what we know today, the longer-term outlook remains constructive.
Could A Shakeout Occur In 2018-2019?
A similar “the bull case is wrong” shakeout could occur over the next year, which reinforces the importance of flexibility, nimbleness, and remaining open to all outcomes. As long as the longer-term outlook remains constructive, short-term frustrations and volatility could still be followed by very satisfying gains. Additional longer-term 2018 charts can be found here.
This article by Chris Ciovacco originally appeared here and has been reprinted by permission of Ciovacco Capital management.
You might also like:
- Recent Breakouts Say a Lot about Markets and Economy
- Are Wars Bullish or Bearish for Stocks?
- Tariffs May Not Slow Profit Momentum
Speak Your Mind