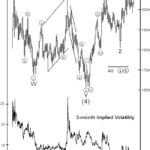
Gold’s three-month implied volatility has declined to its lowest level in over four years. While low volatility is not a short term timing tool, low volatility eventually precedes high volatility. At the same time, total open interest in gold futures has declined to its lowest level since December 2018, as traders are either closing futures contracts or abstaining from opening new ones. The low level of open interest means that investors’ attention is turning away from gold, and the low implied volatility indicates that investors do not expect gold to move much over the course of the next three months. Both are preludes to what we see as a major move forming in gold prices.
Gold: Setting Near-Term Price Targets
April 11, 2024 by Leave a Comment
Even though the mainstream media was looking to so-called fundamentals — such as the action of the dollar or bond yields — Elliott Wave International focused on the patterns of investor psychology
Free report: ‘Gold Investors’ Survival Guide’
March 20, 2024 by Leave a Comment

Gold prices are breaking records so our friends at Elliott Wave International have created a free guide to help you get on the right track.
Gold: See What This Fibonacci Ratio Says About the Trend
August 19, 2020 by Leave a Comment
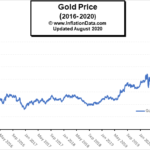
Gold has been a star performer in the markets recently with gold making a new all-time high of $2067.15 on August 6th. From there it retreated to $1931 on August 12th before resuming its climb. On August 18th it closed just above $2000 and then retreated to $1927.90 on August 19th . So we have seen quite a bit of volatility this month in gold. It certainly would be nice to know beforehand where it would stop and turn.
Summer of Love for Gold Bulls: How “Quandary” Became Clarity
August 8, 2019 by Leave a Comment

As mainstream experts struggled to see the direction in gold, Elliott wave analysis saw a clear, bullish triangle. Then, gold prices rocketed to six-year highs!
Do Facts Support Doom and Gloom or Higher Highs for Stocks and/or Gold?
July 25, 2019 by Leave a Comment
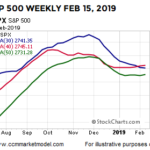
Dating back to 1950, the S&P 500 has only dropped over 40% three times: 1973-74, 2000-02, and 2007-09. In each case after the big drop, something caused investors to change their attitude and behavior related to the attractiveness of common stocks. Major lows are rare and the shifts that occur in the minds of human beings near major lows are rare. History tells us valuable information can be found in rare market events.
Is Gold on the Verge of a Bottom?
August 30, 2018 by Leave a Comment
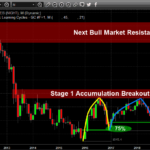
From 2017 until now the Gold chart shows another 75% price retracement from recent highs once again. This second 75% retracement could be a massive bottom formation setting up in Gold and could be a huge “wash-out” low price. We believe this unique retracement is indicative of a massive price breakout over the next year or so as the price of gold is forming what Stan Weinstein calls a Stage 1 Accumulation.
The Stock Market Big Picture
June 20, 2018 by Leave a Comment
One of the keys to making more prudent and rational decisions is to look at more than just the red screen in front of us, which represents only one timeframe (the shortest). It can also be helpful to think in extremes.
Gold: Often, Simple Forecasting Tools Are All You Need
September 21, 2017 by Leave a Comment
In the following video by Elliott Wave International we will look at the gold price and “Commitment of Traders” In 2017, Gold ‘s rally has stalled three times in April, June and August. With April and June’s price stalling at the same overhead resistance level. Back in August Elliott Wave TV said, When analyzing charts […]
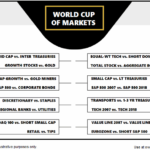
SPX CYCLES, FED FUNDS AND GOLD
July 19, 2017 by Leave a Comment
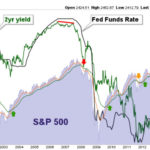
In the following article by Gary Tanashian of Notes from the Rabbit Hole which he refers to as “NFTRH” Gary looks at the 12 month and 30 month S&P 500 cycle, FED Funds and his proprietary Gold “Macrocosm picture” which includes looking at Gold in various currencies. This is important because since gold is an international commodity, if an individual currency is falling it could appear that gold is rising and if a currency is rising (against other currencies) it could appear that gold is falling. So we need to look at gold in terms of a variety of currencies to eliminate the currency exchange issue and determine what gold itself is actually doing rather than gold versus an individual currency.