In the following article by Gary Tanashian of Notes from the Rabbit Hole which he refers to as “NFTRH” Gary looks at the 12 month and 30 month S&P 500 cycle, FED Funds and his proprietary Gold “Macrocosm picture” which includes looking at Gold in various currencies. This is important because since gold is an international commodity, if an individual currency is falling it could appear that gold is rising and if a currency is rising (against other currencies) it could appear that gold is falling. So we need to look at gold in terms of a variety of currencies to eliminate the currency exchange issue and determine what gold itself is actually doing rather than gold versus an individual currency. ~Tim McMahon, editor.
SPX CYCLES, FED FUNDS AND GOLD
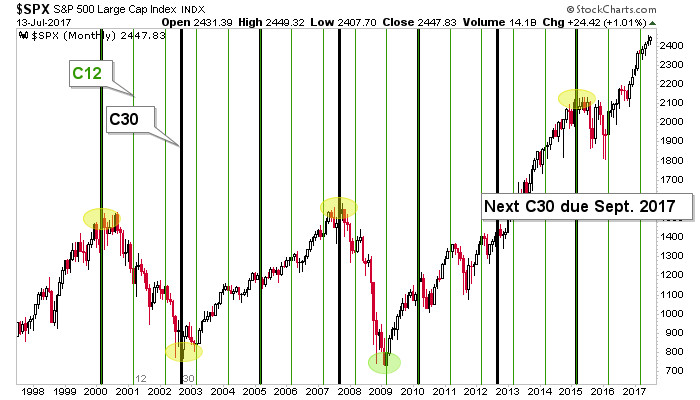
This “amateur cyclist’s” chart (I am anything but a cycles analyst) of the S&P 500 shows that the 12 month marker (C12) meant exactly nothing as the market remained firmly on trend, after brief pokes down in April and May. We noted that C12 was a lesser indicator than the 30 month cycle, which has coincided with some pretty significant changes (+/- a few months). That cycle (C30) is coming due at the end of the summer. Will it mean anything? Well, this market eats top callers for breakfast, lunch, dinner and midnight snacks. But it is worth knowing about to a lucid and well-armed market participant.
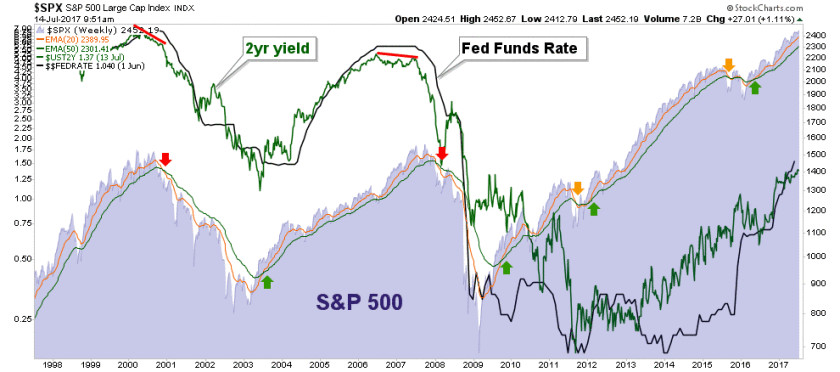
Here is the S&P 500 from another angle. The Fed Funds Rate (as of June 1) is now climbing in unison with the 2yr Treasury yield, and has even exceeded it. A problem for the stock market? Well, not quite yet when viewing historical context. The stock market has continued to climb in the short-term under conditions like this. But you will note that when the 2yr yield began to flatten and turn down, leaving the Fed in ‘overshoot’ territory, the major market tops of 2000 and 2007 were registered. Folks, I am not promoting an agenda, but simply reviewing history.
Indeed, NFTRH has been in bull mode in one way or another since the height of the Brexit hysteria and its low risk bullish signals (as global herds rushed to risk ‘off’ sovereign bonds amid the knock-on NIRP!!! hysteria). More recently we have been bullish but in ‘risk’ mode, which continues and if the above cycles and Fed Funds analysis means anything, will only intensify. High risk does not mean bearish; it means high risk which, especially if the mania intensifies, can go hand in hand with reward.
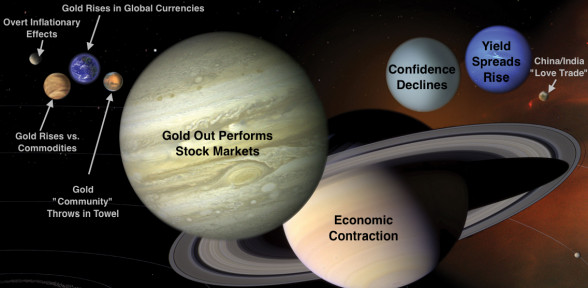
As for the gold sector, look no further than our Macrocosm picture to see why the sector cannot yet be called bullish. At best, there are better places to invest as long as stock markets and the economy are doing well  and out performing gold .
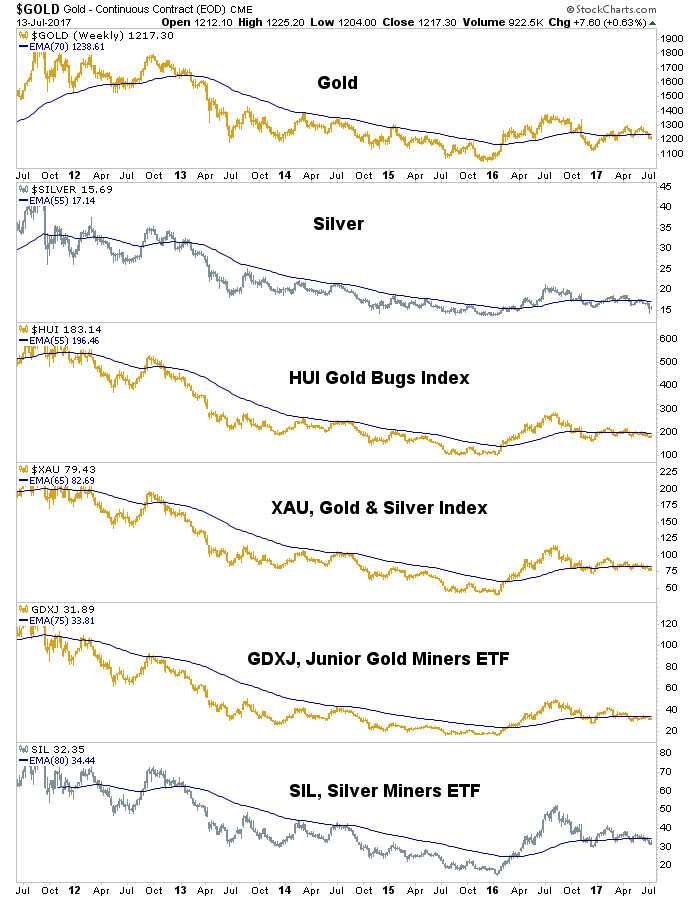
As we go to print on Friday in US pre-market the CPI number came in flat and the gold sector is rightly celebrating the lack of inflation and the ‘dovish Fed’ implications. The positive reaction is news driven (we have expected a bounce based on sentiment, and Yellen/CPI seem to be the rationale) and can be filtered per the weekly charts below. Subscribers have been and will be updated on the parameters to unchaining the sector from its technical lock-down.
But there is a long way to go to undo the negatives. We’ll leave it to promoters and obsessives to micro-manage the sector in the meantime. There is no macro signal here for a real bull phase by the important element of ‘gold vs. stock markets’.
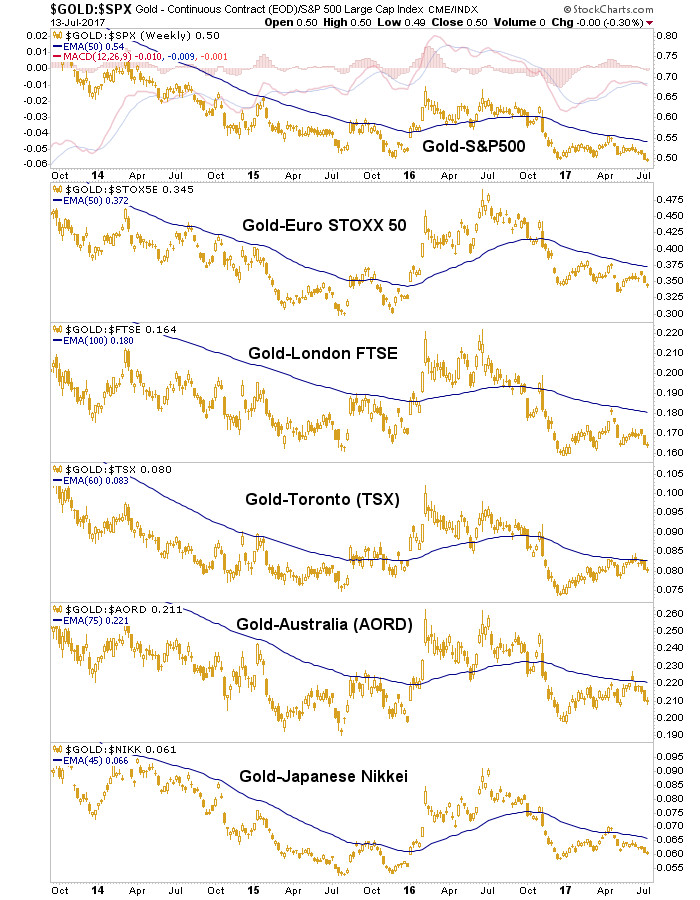
Nor is there much positive going on in the sector’s nominal technical situation.
However, when factoring in the S&P 500 analysis above, considering that the Fed Funds vs. the 2yr yield is nearing signals similar to 2000 and 2007, considering that the 10yr-2yr Treasury yield curve has recently made a move upward (a significant macro fundamental consideration in its own right) and in light of certain positive divergences in quality miners and royalties that we track, we will surely be on alert for coming opportunities in the counter-cyclical precious metals, because things could change at any time.
This article originally appeared here and has been reprinted by permission.
Notes from the Rabbit Hole covers these sectors in detail (including stock charts) each week along with all other major markets (including stock charts) in NFTRH. But this article is intended to give a general view of what is bullish (i.e. bull trending) and what is not… along with some markers for potential changes. Meanwhile, trading can be done long and short in either broad stocks or the gold sector. But understanding current trends is important, until said trends change.
Subscribe to NFTRH Premium for your 40-55 page weekly report, interim updates and NFTRH+ chart and trade ideas or the free eLetter for an introduction to our work. Or simply keep up to date with plenty of public content at NFTRH.com and Biiwii.com.
Speak Your Mind