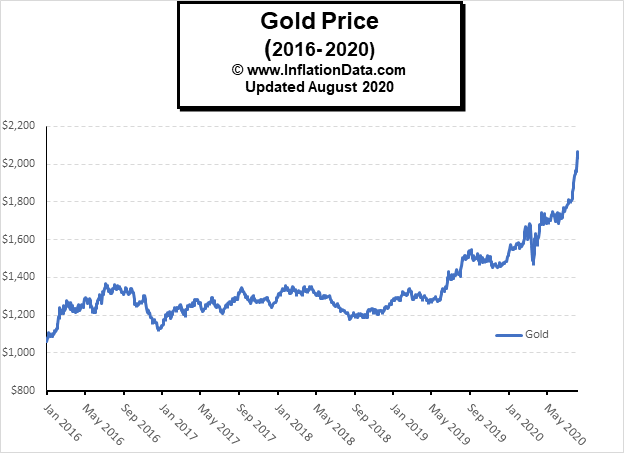
Gold has been a star performer in the markets recently with gold making a new all-time high of $2067.15 on August 6th. From there it retreated to $1931 on August 12th before resuming its climb. On August 18th it closed just above $2000 and then retreated to $1927.90 on August 19th . So we have seen quite a bit of volatility this month in gold. It certainly would be nice to know beforehand where it would stop and turn. ~Tim McMahon, editor
A Fibonacci .618 Retracement is a Common Reversal Point in the Markets
By Elliott Wave International
Fibonacci numbers follow a sequence that begins with 0 and 1, and each subsequent number is the sum of the previous two (0, 1, 1, 2, 3, 5, 8, 13, 21, 34, and so on).
After the first several numbers in the sequence, the ratio of any number to the next higher is approximately .618 to 1; its ratio to the next lower number is approximately 1.618 to 1.
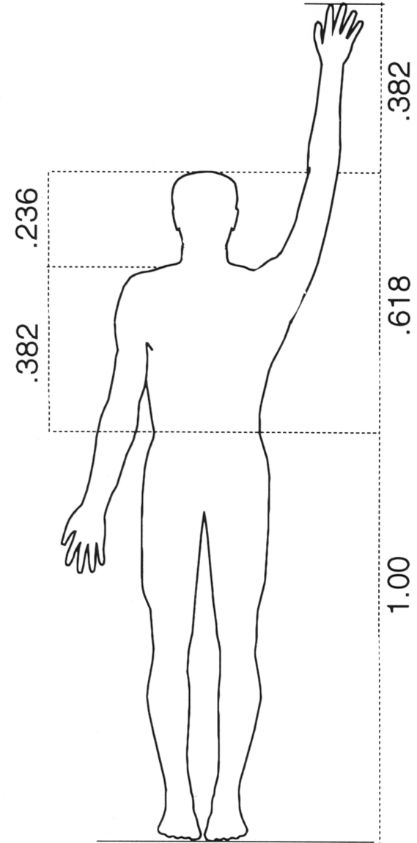
Fibonacci ratios appear throughout nature, from the shape of galaxies and seashells to molecules and even the human body.
The Wall Street classic book, Elliott Wave Principle: Key to Market Behavior, by Frost & Prechter, explains why these ratios should be of keen interest to investors:
The Fibonacci sequence governs the numbers of waves that form in the movement of aggregate stock prices. …
The fact that waves produce the Fibonacci sequence of numbers reveals that man’s collectively expressed emotions are keyed to this mathematical law of nature.
Here’s what you need to know: Price turns often occur when Fibonacci ratios between market moves — or waves, as we call them — have been reached.
Besides the stock market, Fibonacci ratios also show up in the price charts of other financial markets, like gold.
Here’s a 15-minute chart and commentary from the August 10 U.S. Short Term Update, a thrice-weekly Elliott Wave International publication which provides near-term analysis and forecasts for major U.S. markets:
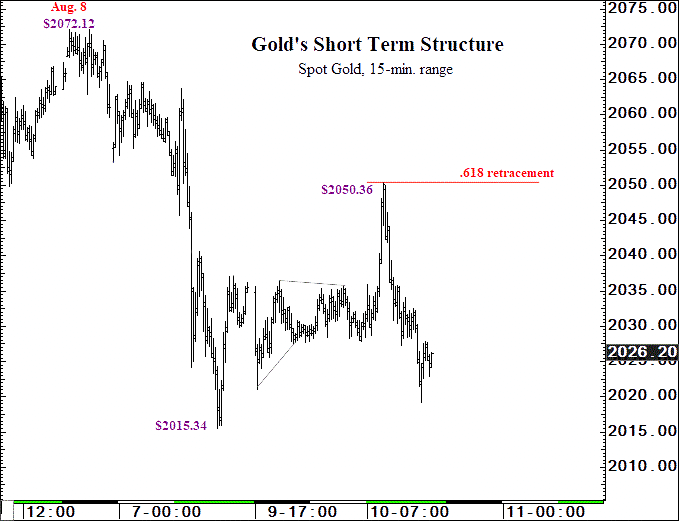
Gold’s high at $2072.12 led to [an Elliott] wave decline to $2015.34 last Friday, as shown on the chart. Since Friday’s low, prices traced out an [Elliott] wave rally where [one] wave took the form of a triangle. At today’s $2050.36 high, gold retraced a Fibonacci .618 of the decline from $2072.12.
Gold, as you know, fell almost 6% on August 11, the very next day after the U.S. Short Term Update showed subscribers this analysis.
But the August 10 U.S. Short Term Update didn’t stop there. It went on to mention specific price targets for gold.
That’s the beauty of the Elliott wave model — it helps investors to anticipate what’s next.
Let’s once again quote from Elliott Wave Principle: Key to Market Behavior:
Without Elliott, there appear to be an infinite number of possibilities for market action. What the Wave Principle provides is a means of first limiting the possibilities and then ordering the relative probabilities of possible future market paths. Elliott’s highly specific rules reduce the number of valid alternatives to a minimum.
Are you ready to “dig in” and absorb all that the Elliott Wave Principle has to offer?
If so, be aware that you can now access the online version of Elliott Wave Principle: Key to Market Behavior — free (no credit card information required — 100% free).
The only step required is to become a Club EWI member, and this is also free with no obligations whatsoever.
Besides free access to Elliott Wave Principle: Key to Market Behavior, members are also granted free reign to review other Elliott wave educational resources on trading, investing and financial markets.
You’ll be in good company when you join. Club EWI has 350,000 online members — and its ranks continue to expand.
Follow this link for free online access to Elliott Wave Principle: Key to Market Behavior.
This article was syndicated by Elliott Wave International and was originally published under the headline Gold: See What This Fibonacci Ratio Says About Trend. EWI is the world’s largest market forecasting firm. Its staff of full-time analysts led by Chartered Market Technician Robert Prechter provides 24-hour-a-day market analysis to institutional and private investors around the world.
You might also like:
Speak Your Mind