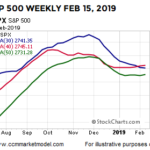
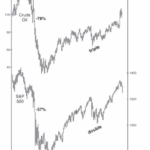
Dating back to 1950, the S&P 500 has only dropped over 40% three times: 1973-74, 2000-02, and 2007-09. In each case after the big drop, something caused investors to change their attitude and behavior related to the attractiveness of common stocks. Major lows are rare and the shifts that occur in the minds of human beings near major lows are rare. History tells us valuable information can be found in rare market events.
Do Facts Support Doom and Gloom or Higher Highs for Stocks and/or Gold?
July 25, 2019 by Leave a Comment
Is War Good for Stocks?
May 30, 2019 by Leave a Comment
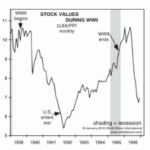
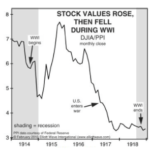
Many people believe that “War is good for Stocks” because the government pumps billions into the economy thus creating jobs and those new employees spend money having a multiplying effect on the economy. And when the economy booms the stock market booms right? In the following chart we can see that shortly after the U.S. entered WWII that the stock market began rising and it continued to rise throughout the remainder of the war. This is possibly why U.S. investors have come to believe that “War is Good for the Market”. But…
Is Banning “Short-Selling” a Solution?
March 19, 2019 by Leave a Comment
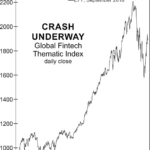
You may not have thought about it but short selling is a key component of modern efficient markets. Typically when you buy and sell things you buy them first hold them for a certain time (whether it is short or long term) and then sell it, (hopefully for more than you paid for it). But what if you feel the item is currently waaay too expensive? In that case, you can “sell short” in this case you borrow the item from a broker, sell it and when the price goes down buy it and return it to the broker. (Of course you have to pay the broker for any missed dividends and a “fee” for loaning it to you). But if the stock falls enough you can make a nice profit. According to Investopedia, “Short selling strengthens the market by exposing which companies’ stock prices are too high. In their search for overvalued firms, short sellers can discover accounting inconsistencies or other questionable practices before the market at large does.” So in effect, short sellers are registering a “negative vote” saying that they believe this stock is overpriced. But when bull-market hope turns to bear-market fear, short selling is often vilified as the cause of market crashes (rather than the fact that the short sellers were just observant enough to recognize overpriced stocks when they see them). This shift may be underway in Europe now. Whenever new technology enters a market it causes disruptions and eventually the old tech suffers as it is displaced by the new. Right now “FinTech” or Financial Technology is causing disruptions in Europe and as you would expect, the traditional financial services companies don’t like it. But the public becomes enamored with the new tech and drives up the price (often to extremely unreasonable levels). Once “irrational exuberance” takes over and the price of the stocks gets carried away then the short sellers come in with their “the emperor isn’t wearing any clothes” and the price of the new tech crashes until it can build a firm base, show real profits and begin climbing again. ~Tim McMahon, editor.
Reversals And Counter-trend Moves Typically Take Time To Develop
January 10, 2019 by Leave a Comment
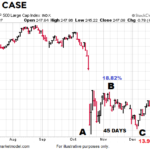
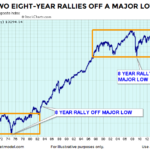
Since investor psychology tends to be similar after a sharp plunge in the stock market, subsequent bottoms and/or countertrend rallies often share similar characteristics… making determining which is which more difficult.
Are Falling Oil Prices Really Good for the Stock Market?
November 8, 2018 by Leave a Comment
It makes sense that falling oil prices would be good for stocks, after all it should lower company’s cost for energy and therefore increase profitability. However, in October 2018 both Oil prices and Stock prices fell simultaneously. So, “What’s Up with that?” In today’s post the Editors at Elliott Wave International will look at the relationship between Oil and Stocks.
The Stock Market Big Picture
June 20, 2018 by Leave a Comment
One of the keys to making more prudent and rational decisions is to look at more than just the red screen in front of us, which represents only one timeframe (the shortest). It can also be helpful to think in extremes.
Are Wars Bullish or Bearish for Stocks?
April 19, 2018 by Leave a Comment
The following article was originally published by Elliott Wave International under the title Is War “Hell” for the stock market? And it looks at the stock market performance during various wars and also during times of peace to see if there is a correlation between the market performance and the existence or absence of war.
Stocks Can’t Keep Going Up Forever… Or Can They?
January 22, 2018 by Leave a Comment
Wall Street traders love to live by “truisms”, “clichés”, and/or “maxims”. One such refrain that we constantly hear is that “Stocks can’t keep going up forever” but then there is “the trend is your friend” and “the market climbs a wall of worry”. When you put them all together what do you get? Should you worry about a top or should you be happy that others are still worried… because that means the top isn’t here yet? After-all, the market continues to climb until everyone has bought. If there are still bears out there, they are still potential buyers. On our NYSE Rate of Change page we published a couple of charts by “Chart of the Day” which showed the average length of rallies before a 15% and 20% decline. But if you take a longer term view, even a 15-20% correction could be inside a longer term bull market.
In today’s post, Chris Ciovacco of Ciovacco Capital Management takes a look at the historical precedent for the current market.
New Long-Term Equity Breakout
January 10, 2018 by Leave a Comment
On Tuesday, CME and CBOE TV financial commentator Alan Knuckman said on Fox Business, “Trump’s historic tax cuts will boost most American corporate earnings lines by at least 20% in 2018 — sending stocks soaring still from their current levels.” He is predicting that the Dow will reach 30,000. He said, “The Dow Jones Industrial Index is now within 21% of the 30,000 milestone which is very achievable after returning 25% in 2017.”
But after being up so much in 2017 isn’t it “overvalued”? You might ask. One reason for optimism is that even after being up so much earnings are up about the same amount. So the P/E ratio is roughly where it was a year ago, i.e. slightly above 21%. That is just slightly above the average level and well below peak levels. With corporate earnings up another 20% due to tax reform this year, prices could go up that much as well and the market still wouldn’t be overvalued.
Skeptical Bias Toward Stocks Aligns With Bullish Charts
August 31, 2017 by Leave a Comment
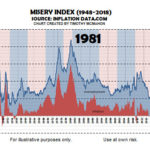
If someone told us in 1981 the S&P 500 would post a 1,367% gain over the next 18 years, it would have been very difficult to believe after seeing an all-time high in the misery index in June 1980. From miseryindex.us:
“The misery index is simply the unemployment rate added to the inflation rate. It is assumed that both a higher rate of unemployment and a worsening of inflation both create economic and social costs for a country. A combination of rising inflation and more people out of work implies a deterioration in economic performance and a rise in the misery index.”