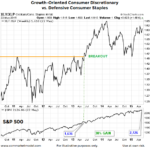
When investors are confident about future economic outcomes, they tend to prefer growth-oriented XLY (consumer discretionary) over defensive-oriented XLP (consumer staples). The 2002-2009 chart below shows the XLY:XLP ratio consolidated for several years before breaking down in October 2007.
Tariffs May Not Slow Profit Momentum
March 28, 2018 by 2 Comments
BIG IMPACT OR SMALL IMPACT? U.S. Treasury Secretary Steven Mnuchin indicated Sunday the U.S. is hopeful to strike a deal with China, which means the tariffs would never go into effect. However, if a deal cannot be reached, how significant are the tariffs relative to the big picture? From CNBC: Jeremy Zirin, head of investment strategy […]
New Long-Term Equity Breakout
January 10, 2018 by Leave a Comment
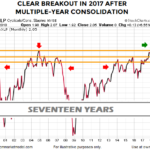
On Tuesday, CME and CBOE TV financial commentator Alan Knuckman said on Fox Business, “Trump’s historic tax cuts will boost most American corporate earnings lines by at least 20% in 2018 — sending stocks soaring still from their current levels.” He is predicting that the Dow will reach 30,000. He said, “The Dow Jones Industrial Index is now within 21% of the 30,000 milestone which is very achievable after returning 25% in 2017.”
But after being up so much in 2017 isn’t it “overvalued”? You might ask. One reason for optimism is that even after being up so much earnings are up about the same amount. So the P/E ratio is roughly where it was a year ago, i.e. slightly above 21%. That is just slightly above the average level and well below peak levels. With corporate earnings up another 20% due to tax reform this year, prices could go up that much as well and the market still wouldn’t be overvalued.
Key Charts For Fed Day
July 27, 2016 by Leave a Comment
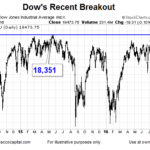
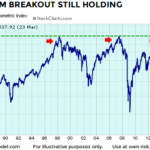
A retest of prior resistance may be in the cards, which is exactly what happened in early 1995. In 2016, the Dow Jones Industrial Average (below) may be in retest mode.