Seeking Certainty in Uncertain Times?

What seems like ages ago but in reality was just the beginning of this year… life was simple. The market was humming along, unemployment was at record lows, inflation was moderate and life was good. And now just a few months later, there are riots in the streets, unemployment is at record highs, and people are filling up the hospital’s ICUs. 

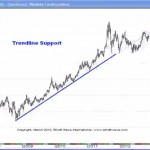
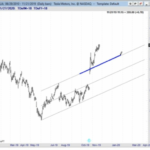
Over the years, we have experienced many ups and downs but rarely in such close succession. But our first line of defense is always the “trendline” (no pun intended). A trendline can tell you both the market direction and its parameters. And if you have read much of what we do, both here and at Financial Trend Forecaster you will know that understanding the trend and using trendlines is a key part of our function. 

Using Trend Lines and Identifying Support and Resistance

One of the most basic skills necessary when looking at a stock chart is using trend lines and identifying support and resistance. Unfortunately, sometimes as we learn more sophisticated methods we tend to forget the basics. So if you are just starting in the markets or you are a more advanced trader, you may find this information valuable.

Trendlines: How a Straight Line on a Chart Helps You Identify the Trend

Technical analysis of financial markets does not have to be complicated. Here are EWI, our main focus is on Elliott wave patterns in market charts, but we also employ other tools — like trendlines. A trendline is a line on a chart that connects two points. Simple? Yes. Effective? You be the judge — once […]

How a Simple Line Can Improve Your Trading Success

The following trading lesson has been adapted from Jeffrey Kennedy’s eBook, Trading the Line – 5 Ways You Can Use Trendlines to Improve Your Trading Decisions. Now through February 7, you can download the 14-page eBook free. Learn more here. “How to draw a trendline” is one of the first things people learn when they […]