What seems like ages ago but in reality was just the beginning of this year… life was simple. The market was humming along, unemployment was at record lows, inflation was moderate and life was good.
And now just a few months later, there are riots in the streets, unemployment is at record highs, and people are filling up the hospital’s ICUs.
Over the years, we have experienced many ups and downs but rarely in such close succession. But our first line of defense is always the “trendline” (no pun intended). A trendline can tell you both the market direction and its parameters. And if you have read much of what we do, both here and at Financial Trend Forecaster you will know that understanding the trend and using trendlines is a key part of our function.
In today’s article, the editors at Elliott Wave International have shared the importance of trendlines in times of uncertainty.
~Tim McMahon, editor.
Seeking Certainty in Uncertain Times? Draw a Trendline — Learn How
By Elliott Wave International
Elliott Wave International’s online trading course teaches traders how to identify, draw, and use trendlines to seize high-confidence set-ups in any market, on any time frame — Now FREE through July 14!
Today, the lines between what life looked like before the global pandemic of 2020 — and what it’ll look like after — seem forever blurred. Will we have the same job? Will our formerly college-bound children ever leave the house? Will we even live in the same state, or the same country?
Being a trader in times like these, even if only as a fallback option, is not a bad idea.
If that thought has crossed your mind, how would you like to learn a simple technique to identify new trading opportunities?
That technique is drawing trendlines. Elliott Wave International’s trading instructor Jeffrey Kennedy says:
“Trendlines are the simplest and most effective analytical tool traders can apply, be it to a stock, currency, or commodity.”
“They’re more effective than people realize.”
“And so simple, a kid with a ruler can use them.”
Hey, just think! You can add trendline drawing to your child’s at-home school curriculum…
But seriously, folks! There is a reason why Elliott Wave International is bringing back Jeffrey Kennedy’s popular online course “How to Use Trendlines to Spot Reversals and Ride Trends” now.
Today, millions of people around the world are turning to trading at home for the first time. The search for guidance is at an all-time high. If you’re one of them, or even if you’re an experienced trader, this course is for you … and you can take it today 100% free. (More on that below.)
But first — trendlines are simple straight lines connecting two price extremes on a chart. When you draw more than one, you create a so-called trend channel and see both the future trend and trend reversals.
Simple? Yes. And the results can be impressive.
Here’s a real-life example from Elliott Wave International’s Trader’s Classroom, which Jeffrey Kennedy edits: Tesla Motors, Inc. (TSLA).
Tesla’s shareholders are used to the fact that the company’s CEO Elon Musk can be a loose cannon, prone to unpredictable behavior like performing a striptease at a new model launch in China.
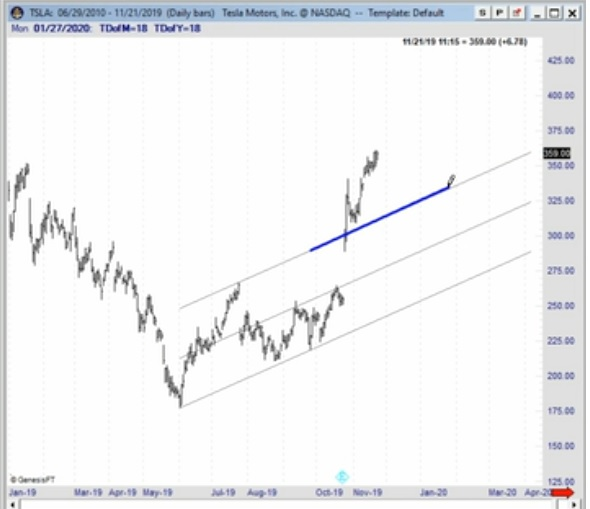
But in his November 21, 2019 Trader’s Classroom — before TSLA zoomed above $1000 — Jeffrey showed how simple trendline analysis made the coming rally quite predictable:
“We’ve gotten above the upper boundary line of the developing base channel.”
“I think we’re going to see a run on say 475-500″ by the end of 2019.”
“This is a ‘very confident buy-side opportunity.'”
From there, TSLA rocketed 60% in December and January to new all-time highs:
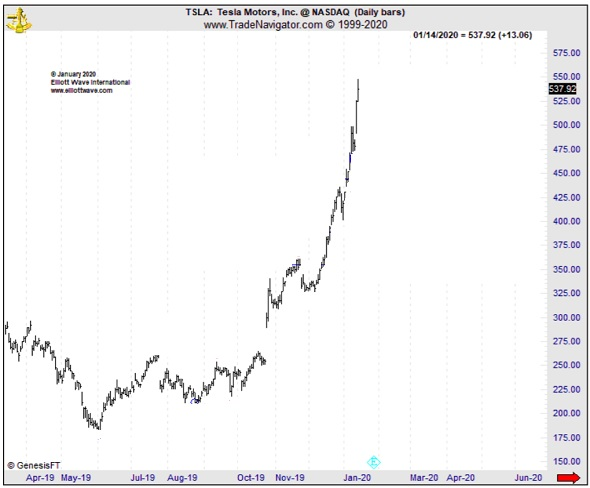
Today, as you know, TSLA is an investor darling, with prices hovering well above $1000.
But what got the rally started — before most people would look twice at the stock — was a simple bullish trendline break.
“How to Use Trendlines to Spot Reversals and Ride Trends” gives you 90+ minutes of trading lessons that teach you how to effectively use this tool.
You’ll learn how to:
- Quickly identify a trend — up, down or sideways
- See if investor psychology is supporting the trend
- Define critical support and resistance levels for tight risk management
- See when a correction is over and the trend is resuming
Most importantly, you’ll learn to recognize when a new opportunity is REAL or “fake.”
AND HERE’S THE BEST PART … THIS COURSE IS FREE!
Through July 14, you can take Jeffrey Kennedy’s online trading course, “How to Use Trendlines to Spot Reversals and Ride Trends,” 100% free as a member of Elliott Wave International’s Club EWI.
Club EWI really is free — there is no fee or credit card required to join its 350,000+ online members.
All you need is 30 seconds to get a free Club EWI password — and you can take the trendlines course instantly.
By the way, at Elliott Wave International’s online Store, this course sells for $79. So, don’t miss this free opportunity to learn a useful skill. Take this online course now, FREE.
[Editor’s Note: Even though I’ve been drawing trendlines for years (and writing about them) I gained a new insight in the very first lesson. So whether you ar just starting out or an “old hand” this series of lessons can prove valuable and you can’t beat the price! Free! ~Tim McMahon, editor]
Speak Your Mind