As of the close Tuesday, the bulls remained in control, but there are reasons to pay attention this week with an open mind:
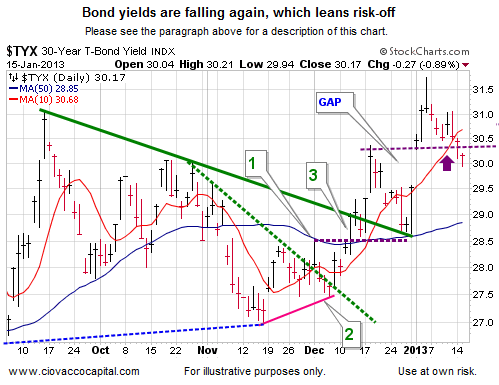
- Bond yields are falling, which leans risk-off.
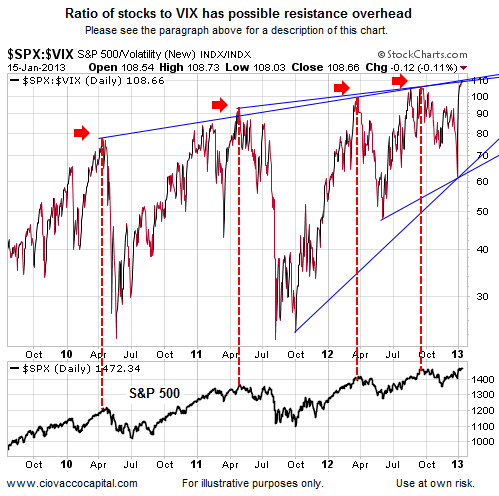
- The ratio of stocks vs. the VIX is facing overhead resistance.
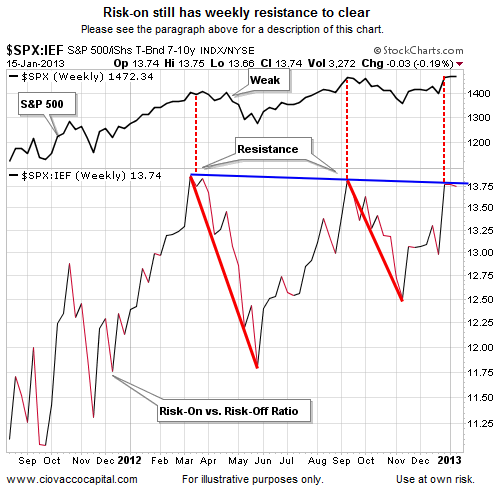
- The ratio of stocks vs. bonds has stalled.
- The European economy remains vulnerable.
Bond Yields Say “Pay Attention”
When demand for safe-haven bonds picks up, bond yields fall. Falling bond yields signal concerns about future economic growth and/or the sustainability of gains in risk assets, such as stocks. As shown below, long-term yields peaked in early 2013. The trend in yields is still up, but further declines would increase our concerns about the current stock market rally. There are no red flags in the chart below, but it is fair to say yellow flags have been raised.
On the fundamental front, industrial production increased for the second straight month in December. Another read on the economy comes Tuesday at 2:00 PM ET in the form of the Fed’s Beige Book.
Fear Index Nearing Relative Support
The risk-on vs. risk-off ratio below shows the performance of stocks relative to the VIX “fear index”. When the ratio is rising, stocks are in greater demand than the VIX. When the ratio is falling, the desire to own the VIX is greater than the desire to own stocks (a.k.a. risk-off). When the ratio has been turned back at the blue trendlines below (red arrows), the S&P 500 has performed poorly (see bottom of chart). Investors will learn a great deal about the next leg in stocks based on how the ratio below performs near possible resistance.
Earnings could impact the charts shown here. Thursday brings releases from Bank of America (BAC) and Citigroup (C). Blue-chip GE is on deck for Friday, along with Morgan Stanley (MS) and Schlumberger (SLB).
Safe-Haven Bonds Attracting Buyers
Another risk-on vs. risk-off ratio used in our proprietary market models is the S&P 500 (SPY) relative to 7-10-year Treasuries (IEF). When the ratio is rising, stocks are in favor relative to bonds (see chart below). When the ratio is falling, bonds are strong relative to stocks. Like the VIX ratio covered previously, the stock/bond ratio is facing weekly resistance. Note how the S&P 500 fared the two previous times the blue trendline acted as resistance (stocks did poorly).
As described at the 26:41 mark of the video below, weekly indicators for SPY/IEF are still siding with risk-on. The video also covers DeMark counts for the S&P 500 beginning at the 3:21 mark. Bullish weekly momentum for stocks is covered beginning at the 20:14 mark.
After you click play, use the button in the lower-right corner of the video player to view in full-screen mode. Hit Esc to exit full-screen mode.
Auto Demand Plunges In Europe
European stocks were leaders off the June 2012 low and continue to lead. While austerity can be an economic positive in the long-run, it reduces spending and incomes in the short-run. European consumers have become more conservative. Demand for new cars in recession-bound Europe fell to a 17-year low in 2012. We are keeping a watchful eye on German (EWG), Italian (EWI), and Spanish (EWP) stocks.
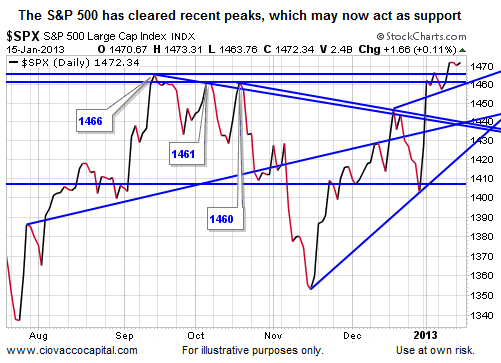
Bulls In Control With Support Nearby
How can the charts presented here help us? We often to refer to resistance as “possible resistance” since a bullish breakout is always possible. We do not have to guess which way the charts will break (bullish or bearish). We can simply observe what transpires and make any needed adjustments on the fly. As noted previously, the bulls are in control as of Tuesday’s close. The tweet below (@CiovaccoCapital) summarizes our stance in this bullish, but hesitant environment.

While the S&P 500 has yet to clear the September intraday high of 1474, it has made a higher high on a closing basis (see chart below). The blue lines represent areas of possible support, meaning the bears have some hurdles of their own should stock market weakness return.
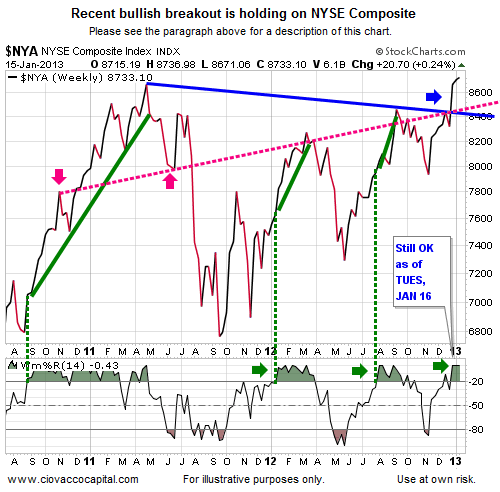
The weekly chart of the NYSE Composite below provides an example of why we keep saying the bulls are still in control. The indicator at the bottom tracks market momentum. Notice when momentum is in “overbought” territory (green arrows), stocks have performed well (follow green dotted lines up). Our concerns would increase when the indicator drops below overbought territory (below -20).
We have been long only (no shorts, no hedges) since noting bullish improvements on November 19, 2012. Since then, the S&P 500 has tacked on 127 points. We will remain invested as long as the charts and fundamentals allow, which could be for several more weeks or just a matter of days.
This entry was posted on Wednesday, January 16th, 2013 at 11:10 am and is filed under Stocks – U.S..
Copyright © 2010 Ciovacco Capital Management, LLC. All Rights Reserved. Chris Ciovacco is the Chief Investment Officer for Ciovacco Capital Management, LLC (CCM). Terms of Use. This article contains the current opinions of the author but not necessarily those of CCM. The opinions are subject to change without notice. This article is distributed for informational purposes only and should not be considered as investment advice or a recommendation of any particular security, strategy or investment product. The charts and comments are not recommendations to buy or sell any security. Market sectors and related ETFs are selected based on his opinion as to their importance in providing the viewer a comprehensive summary of market conditions for the featured period. Chart annotations are not predictive of any future market action rather they only demonstrate the opinion of the author as to a range of possibilities going forward. All material presented herein is believed to be reliable but we cannot attest to its accuracy. The information contained herein (including historical prices or values) has been obtained from sources that Ciovacco Capital Management (CCM) considers to be reliable; however, CCM makes no representation as to, or accepts any responsibility or liability for, the accuracy or completeness of the information contained herein or any decision made or action taken by you or any third party in reliance upon the data. Some results are derived using historical estimations from available data. Investment recommendations may change and readers are urged to check with tax and investment advisors before making any investment decisions. Opinions expressed in these reports may change without prior notice. This memorandum is based on information available to the public. No representation is made that it is accurate or complete. This memorandum is not an offer to buy or sell or a solicitation of an offer to buy or sell the securities mentioned. The investments discussed in this report may be unsuitable for investors depending on their specific investment objectives and financial position. Past performance is not necessarily a guide to future performance. The price or value of the investments to which this report relates, either directly or indirectly, may fall or rise against the interest of investors. All prices and yields contained in this report are subject to change without notice. This information is based on hypothetical assumptions and is intended for illustrative purposes only. PAST PERFORMANCE DOES NOT GUARANTEE FUTURE RESULTS. CCM would like to thank StockCharts.com for helping Short Takes create great looking charts
Speak Your Mind