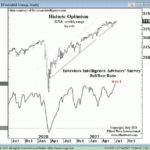
Most stock market investors get fooled at major price turns. Why? Because a bottom never feels like a bottom and a top never feels like a top – how many bears could you count in 2007, right before stocks tanked and the Great Recession followed? This idea was embodied by the quote attributed to Barron Rothschild, an 18th-century member of the Rothschild banking family. He said that “the time to buy is when there’s blood running in the streets.”
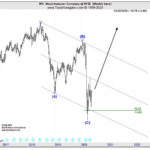
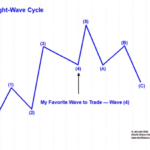
Elliott Wave Analysis Can Help You See Countertrends. Pattern in Focus: the Zigzag.
May 14, 2021 by Leave a Comment
Often, as traders and investors we start off with an open mind about playing the field, so to speak. We watch the news, listen to friends and colleagues — and we try to apply what’s known as “fundamental” market analysis to make our trading decisions. Soon, though, we start to realize that the “bullet-proof” logic of “fundamental” analysis is not Kevlar, but a piece of cardboard. We see markets fall after good news; rally after bad; and go sideways, defying both bulls and bears. That’s when we realize that trading is not as easy as it seems.
Capital Gains Tax Hike News: Was It REALLY to Blame for Sell-off?
May 8, 2021 by Leave a Comment
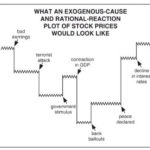
As Elliott Wave International has noted many times, the mainstream financial press always tries to find a reason for a given trading day’s stock market action.
In other words, if stocks happen to be up for the day, many financial journalists will say it was because of this or that “positive” news. If stocks happen to be down for the day, you got it, these journalists will ignore the positive news and search for something “negative” that happened in the country or world and say that was the reason stocks went down.
Why Most Investors Miss Major Stock Market Turns
December 18, 2020 by Leave a Comment
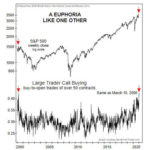
Is Dow 100,000 just down the road? One financial commentator makes the case. At the same time, realize that extraordinarily bold forecasts usually occur at a particular juncture during a market’s trend. ~Tim McMahon, editor
This High-Confident Trade Set-up Makes for Highly-Confident Traders
December 3, 2020 by Leave a Comment
“Confident trader.” Ten-fifteen years ago, the idea used to be an oxymoron — and now, it’s a multi-billion self-help industry with everyone from Wall Street gurus to armchair experts offering their brand of motivational wisdom:
Does the Stock Market Really “See” the Future?
September 11, 2020 by Leave a Comment
the market follows the Wave Principle. It is not governed by the anticipation of future events, or for that matter, current events or anything external to the market.
Forecasting Markets by Looking at Chart Patterns
July 28, 2020 by Leave a Comment

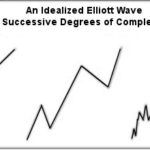
The word “fractal” often means different things to the lay public compared to mathematicians. The public tends to think of fractal art while mathematicians think of the formula that generates the art. The mathematical concept is difficult to define formally, even for mathematicians, but the key feature of a fractal is that if you “zoom in” nothing changes, the same pattern just repeats over and over. The interesting thing is that fractals appear quite frequently in nature. From things as small as DNA, to Snowflakes and Crystals, to Pineapples, Ocean waves and Mountain Ranges, fractals are everywhere. Interestingly, they are also present in the stock market as we look at Minute Charts, compared to Hourly, Daily, Weekly, Monthly, etc.
Seeking Certainty in Uncertain Times?
July 10, 2020 by Leave a Comment
What seems like ages ago but in reality was just the beginning of this year… life was simple. The market was humming along, unemployment was at record lows, inflation was moderate and life was good. And now just a few months later, there are riots in the streets, unemployment is at record highs, and people are filling up the hospital’s ICUs.
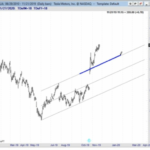
Over the years, we have experienced many ups and downs but rarely in such close succession. But our first line of defense is always the “trendline” (no pun intended). A trendline can tell you both the market direction and its parameters. And if you have read much of what we do, both here and at Financial Trend Forecaster you will know that understanding the trend and using trendlines is a key part of our function.
Junk Bonds: 2 “Golden” Junctures
March 28, 2020 by Leave a Comment
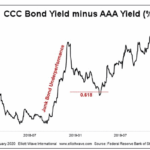
The Golden Ratio — 1.618 or .618 — is ubiquitous throughout nature. You’ll find this mathematical proportion in the shapes of galaxies, sea horses, pine cones, the arrangement of seeds on a sunflower head, and numerous other natural phenomena… including the chart patterns of financial markets.
Repeating Patterns = Profit Potential
January 31, 2020 by Leave a Comment
As shown in the charts, the S&P 500 performed quite well walking forward from February 1, 2013 and December 9. 2016, both periods are similar to December 23, 2019, which tells us to remain open to better than expected outcomes in 2020.