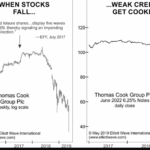
On Sept. 22, Britain’s Thomas Cook, the world’s 2nd largest travel agency, collapsed. The 178-year-old firm blamed it on many factors: weather, terrorism, Brexit… But would you believe that Elliott waves foresaw the coming demise as early as 2017? In the following article, we’ll look at the unbelievable chart that predicts the collapse.
Spotting High-Confidence Trading Opportunities
September 26, 2019 by Leave a Comment
You know that there are hundreds of technical indicators out there. Sometimes you may have so many flashing signals on your screen that it looks like the motherboard of the Starship Enterprise. Here’s help in choosing the right one. In this free video lesson, the editor of Elliottwave International’s “Trader’s Classroom” service shows his favorite moving average pattern: the “Pinch.”
Summer of Love for Gold Bulls: How “Quandary” Became Clarity
August 8, 2019 by Leave a Comment

As mainstream experts struggled to see the direction in gold, Elliott wave analysis saw a clear, bullish triangle. Then, gold prices rocketed to six-year highs!
The Long-Term Message from the VIX
April 17, 2019 by Leave a Comment
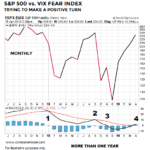
The VIX measures the market’s expectation of future volatility. We can think of the S&P 500/VIX ratio as a way to track confidence in stocks and earnings relative to confidence the market will be volatile. The S&P 500/VIX ratio is currently in the process of trying to complete a relatively rare longer-term shift.
What is the Up/Down Volume Saying About the Current Market?
September 20, 2018 by Leave a Comment
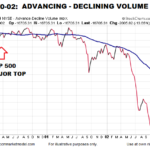
By looking at previous bear markets we can get an idea about how advance/decline volume behaves in bear markets. When the S&P 500 reached a bull/bear tipping point in March 2000, NYSE Advancing – Declining Volume was already waving yellow flags. As shown in the chart below, $NYUD was hugging its 50-week moving average and the 50-week was rolling over in a bearish manner.
Moving Averages Help You Define Trend – Here’s How
August 23, 2018 by Leave a Comment
The “moving average” is a technical indicator of market strength which has stood the test of time.
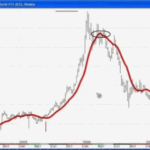
Was the 1,175 Point Drop in the DOW Unpredictable?
February 20, 2018 by Leave a Comment
Prior to February 5th the market had gotten a bit complacent. It had one of the longest bull runs without a significant pullback in recent memory. All that bullishness led to low volatility and made investors lazy and less vigilant. But as we’ll see in the following article by Elliott Wave International market participants should have known better. The market can’t go straight up forever, it needs periods of consolidation to shake out the “weak hands” and build a more solid foundation as it climbs.
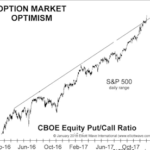
U.S. Stocks: A Sentiment Extreme You MUST Pay Attention to
November 2, 2017 by Leave a Comment

Robert Kelley, the editor of Elliott Wave International’s US Stocks Intraday Pro Service, tells you about a sentiment extreme that he’s seen recently. Watch this new interview to find out what has caught his attention and what they mean for U.S. stocks going forward.
Did You See the 30% Rise in This Major Global Stock Index?
October 5, 2017 by Leave a Comment

In this video Robert Folsom shows the indicators leading the Hong Kong Hang Seng Index to gain 30% in 9 months.
What Does “Paddle-boarding” Have to do with Speculating?
August 26, 2017 by Leave a Comment
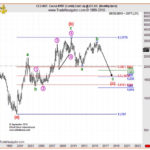
Sometimes when your mind is in the “Zone” unusual correlations will just pop into your head. According to Wikipedia, “The eureka effect (also known as the aha! moment or eureka moment) refers to the common human experience of suddenly understanding a previously incomprehensible problem or concept.” An editor of Elliott Wave International had a eureka aha moment while paddle-boarding and in this article, he looks at Elliott Wave Setups, Cocoa and surprisingly how that correlates to of all things Paddle Boarding. ~ Tim McMahon, editor.