 Two of the most commonly used technical indicators of momentum in trading are the Moving Average Convergence Divergence, or MACD, and the Relative Strength Index (RSI). Today Jeffrey Kennedy is going to be looking at RSI. It was developed by legendary trader J. Welles Wilder. The RSI was first published in Wilder’s 1978 book, New Concepts in Technical Trading Systems.
RSI is a “momentum oscillator”. As the price of a security rises, price momentum increases. The faster the security rises (the greater the period-over-period price change), the larger the increase in momentum. The RSI computes momentum as the ratio of higher closes to lower closes: stocks which have had more or stronger positive changes have a higher RSI than stocks which have had more or stronger negative changes. Once this rise begins to slow, momentum will also slow. Our NYSE ROC chart is a type of Momentum chart (but not an Oscillator).
Unlike our NYSE and NASDAQ ROC the RSI oscillates between zero and 100. Traditionally, and according to Wilder, RSI is considered overbought when above 70 and oversold when below 30. One of Wells Wilder’s most famous quotes is “Letting your emotions override your plan or system is the biggest cause of failure.” ~Tim McMahon, editor
Top 3 Technical Tools Part 2: Relative Strength Index (RSI)
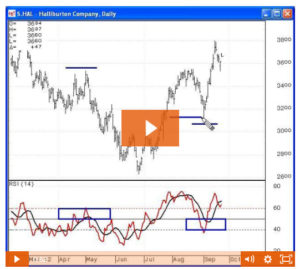
EWI’s senior analyst Jeffrey Kennedy shows you a beautiful example of how supporting indicators help identify a trade setup in Halliburton (HAL).
By Elliott Wave International
“There are many different forms of technical analysis. A completed Elliott wave pattern supported by additional evidence allows for more confident forecasts and higher probability trades.“
– Jeffrey Kennedy
Trader and technical analyst Jeffrey Kennedy has more than 25 years of experience using with the Elliott Wave Principle. To support his Elliott wave analysis, Jeffrey says that 3 of his favorite technical tools are Relative Strength Index (RSI), MACD, and Japanese candlesticks.
This 3-part series includes Jeffrey’s practical lessons and proven techniques to support his wave counts. In Part 1, we covered Japanese Candlesticks. Today’s video clip shows you how RSI range rules can help identify trading opportunities: Part 3 will cover MACD.
This lesson, excerpted from his Trader’s Classroom educational service, gives an overview of RSI followed by a video example. Be sure to look below the video for an opportunity to get more lessons from Jeffrey Kennedy.
~~~~~~~~
Buying pullbacks in uptrends and selling bounces in downtrends are great ways to trade trending markets.
Developed by J. Welles Wilder, Jr. and presented in his 1978 book, “New Concepts in Technical Trading Systems,” RSI measures the strength of a trading vehicle by monitoring changes in closing prices and is considered a leading or coincident indicator. Andrew Cardwell popularized RSI as a trading tool by introducing the concept of range rules.
The theory behind range rules is that countertrend price action in trending markets has specific momentum signatures. RSI, for example will find support within roughly the 50-40 region when pullbacks in uptrends occur. Conversely, when bounces develop in downtrends, RSI will meet resistance in the 50-60 area.
Taking the path of least resistance is a benefit of trading in the direction of the trend. Moreover, the use of RSI and application of Andrew Cardwell’s range rules help identify when a trader can rejoin the trend.
3 Lessons: Learn to Spot Trade Setups on Your ChartsIn these three free video lessons, Jeffrey Kennedy shows you how to look for trading opportunities in your charts. Kennedy, instructor for EWI’s popular Trader’s Classroom service, explains how the 5 core Elliott wave patterns combined with technical methods such as momentum and Japanese candlesticks can help you create a compelling forecast. |
This article was syndicated by Elliott Wave International and was originally published under the headline Top 3 Technical Tools Part 2: Relative Strength Index (RSI). EWI is the world’s largest market forecasting firm. Its staff of full-time analysts led by Chartered Market Technician Robert Prechter provides 24-hour-a-day market analysis to institutional and private investors around the world.
Speak Your Mind